Introduction
Infrastructure around the world is designed to withstand the environmental loads depending on their region. In many heavily populated areas, earthquakes represent the highest threat to the infrastructure's structural integrity. As the structures get ever more complex and optimized, it is vital to be able to predict the behavior of the structure under earthquake loads. There are many different methods used for simulating structural integrity under earthquake loading. In this case study, we will cover how to simulate the structure in the time domain.
Geometry and mesh
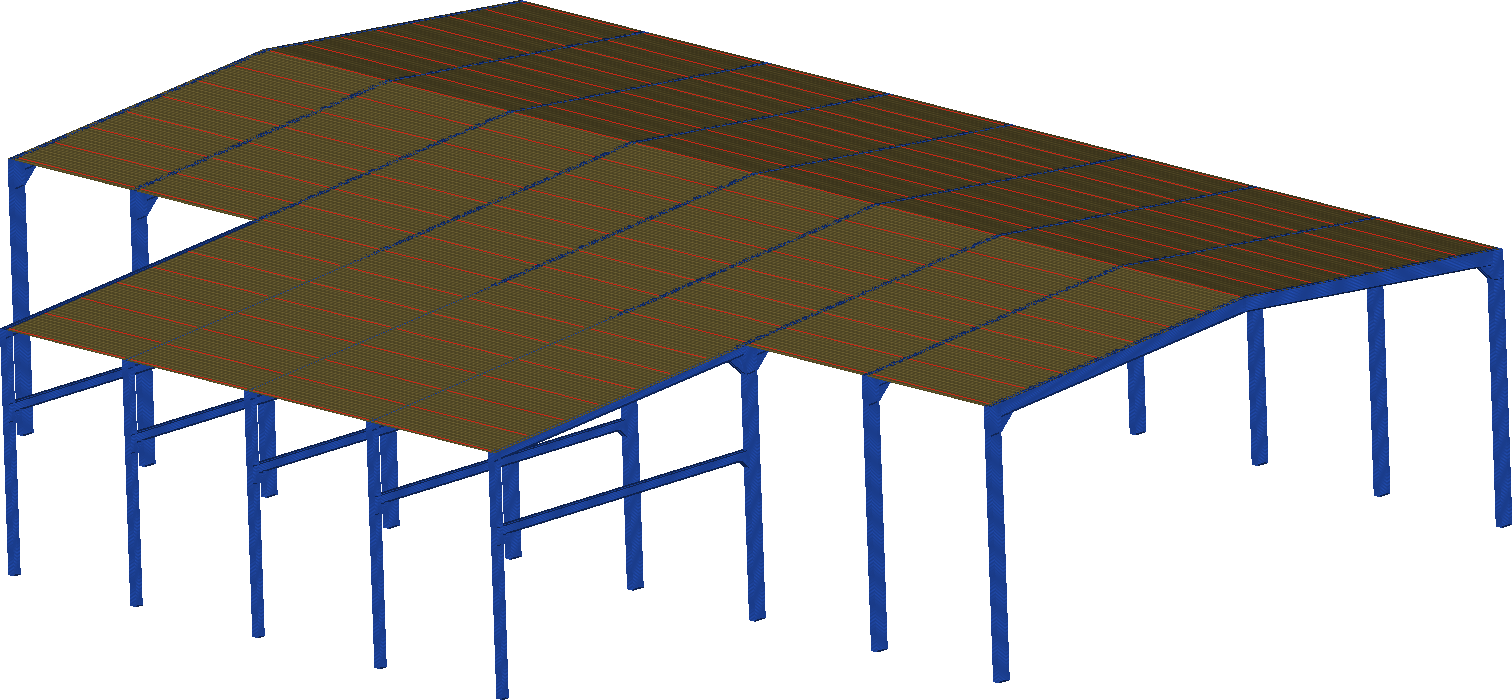
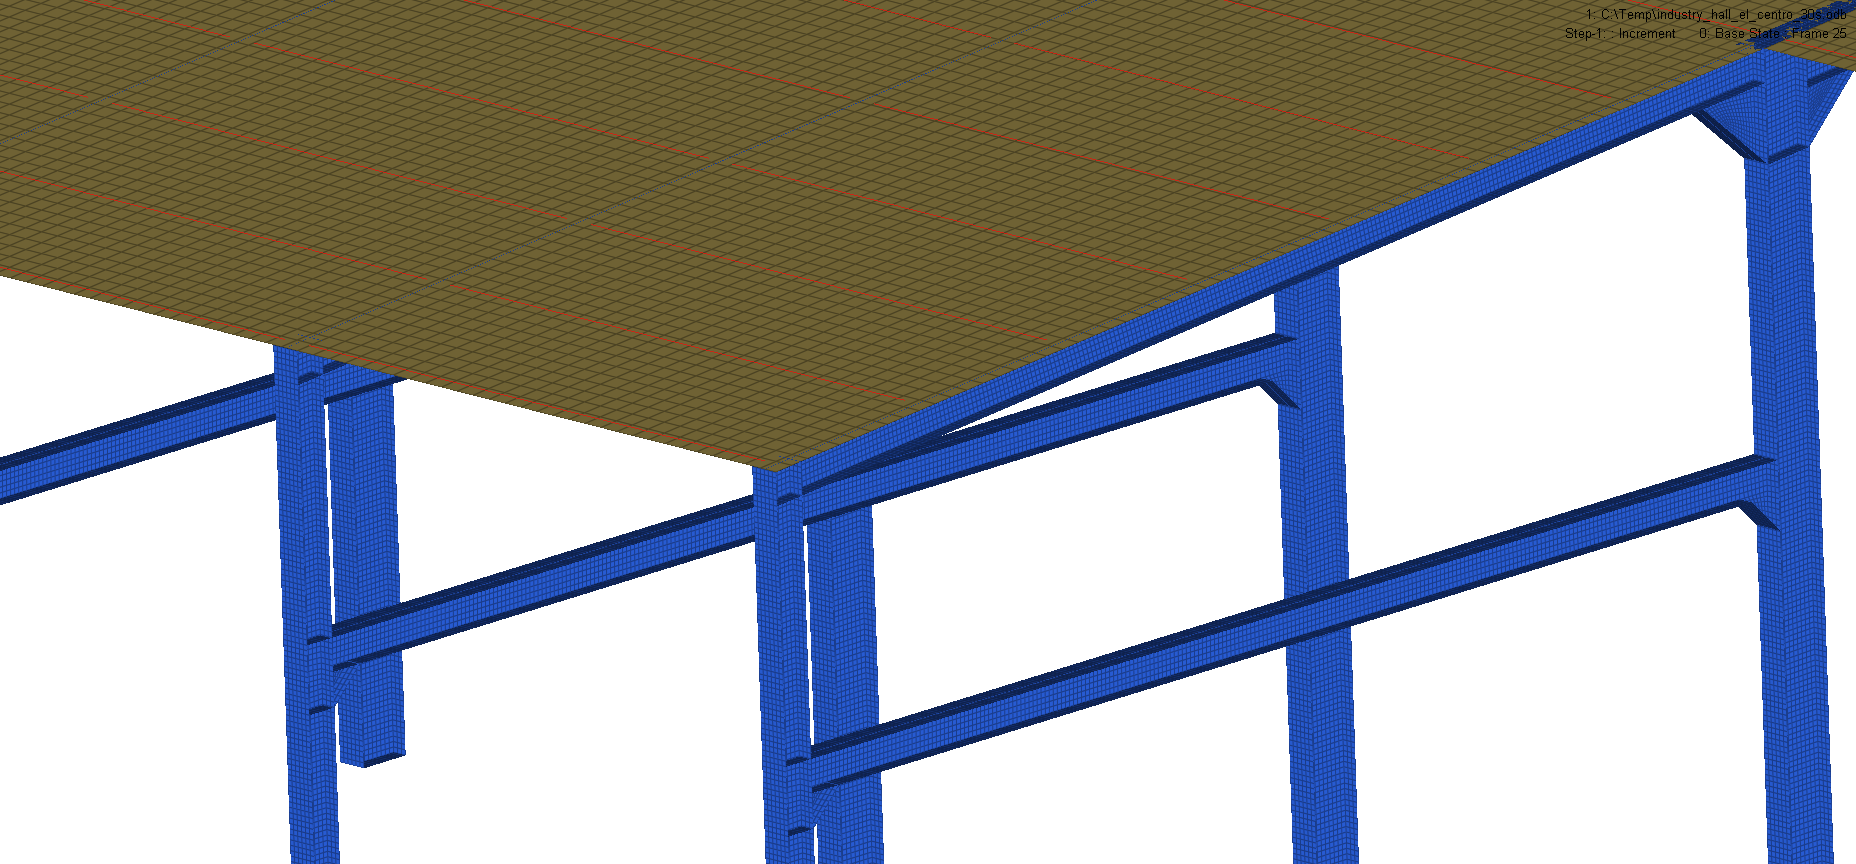
The dimensions of the industry hall were 48x36x10m. The main structure was built from “I” beams that were either welded or bolted together. Transversal beams connected the main beams and served as a support of the roof. The roof was made of simple steel plates. The “I” beams and the roof were simplified with shell elements while the smaller square beams were modeled as beam elements. Finally, the whole model consisted of 300000 finite elements.
Loads and Boundary conditions
There are many ways of analyzing structural integrity against earthquake loading. One of the most widely used is to calculate the response spectrum of the structure subjected to base acceleration. This method is popular because of its simplicity and robustness. On the other hand, the response spectrum method is approximate and can have quite a large margin of error.
In order to overcome this error, we decided to use the modal dynamic approach. In this case, we studied the response of the structure in the time domain with real-time excitation. The response of the structure is obtained from the natural frequencies that are the basis of this method.
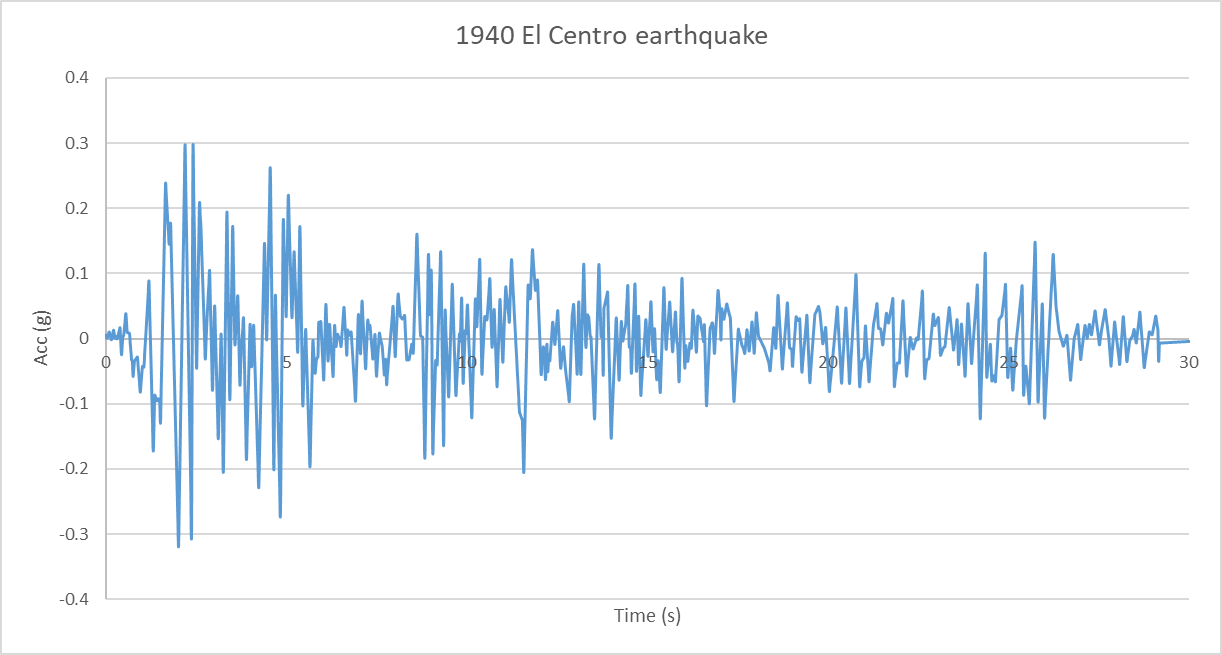
For the natural frequency calculation, the structure was constrained at the base. For the modal dynamic response calculation, real-time domain base acceleration was assigned. The seismic data for this was taken from the 1940 El Centro earthquake. 30 seconds signal of the earthquake can be seen in Figure 3.
Results
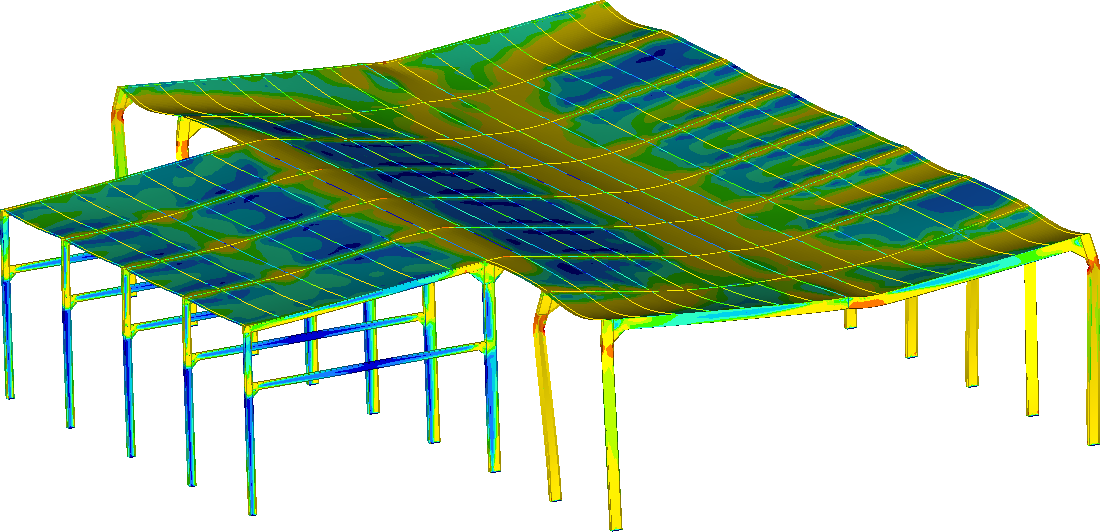
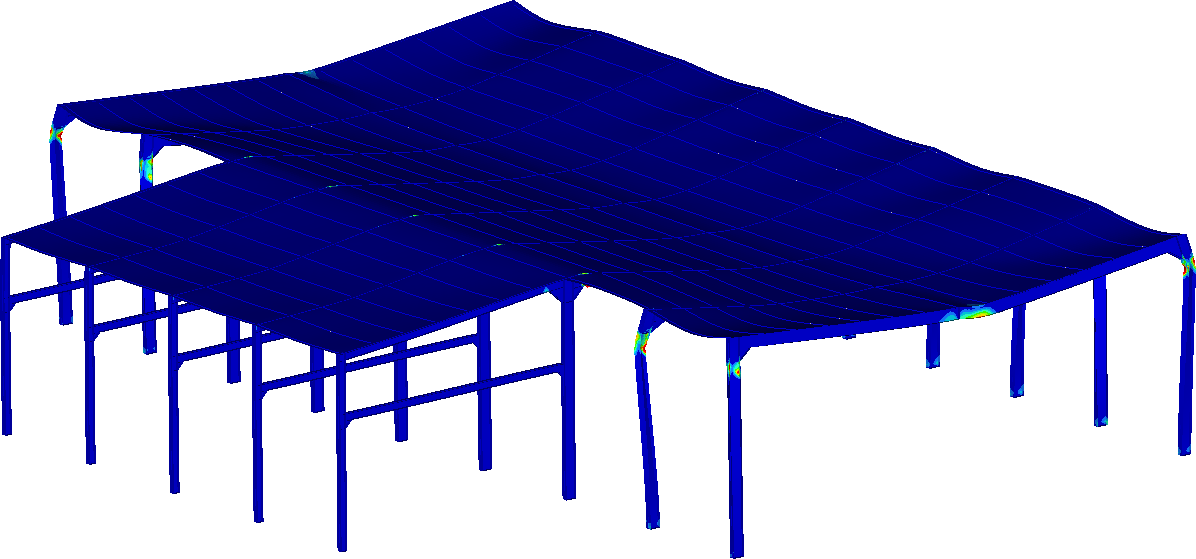
NATURAL FREQUENCIES AND MODE SHAPES
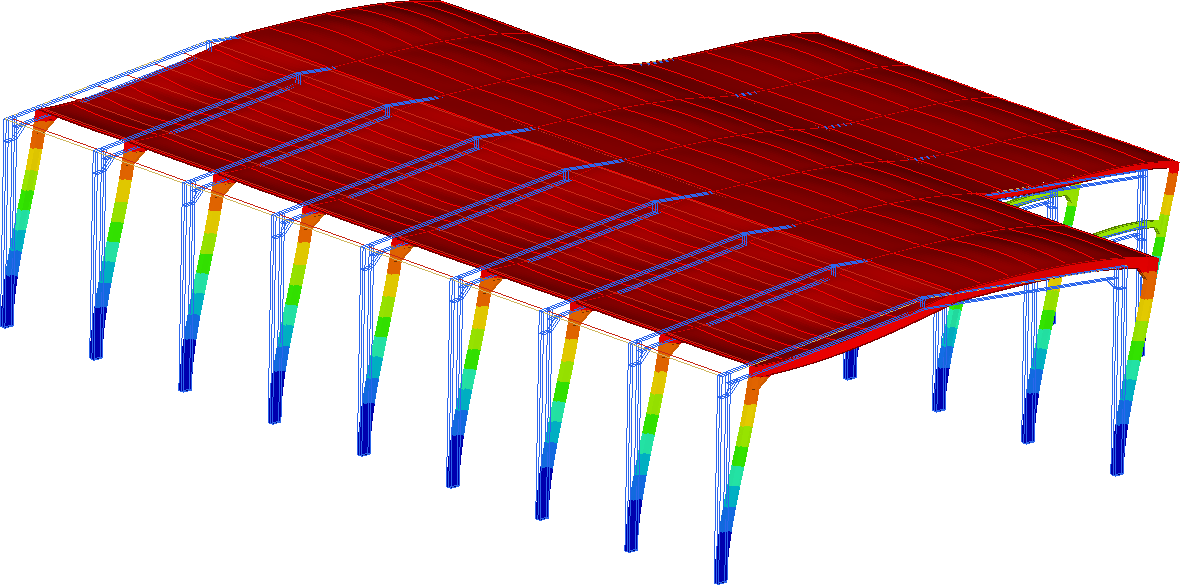
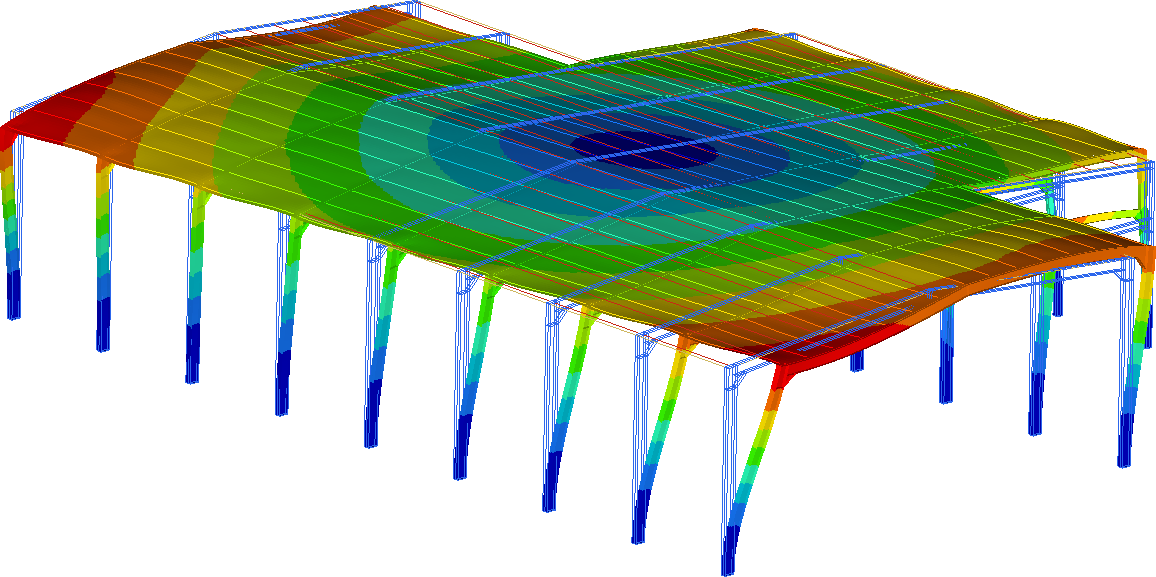
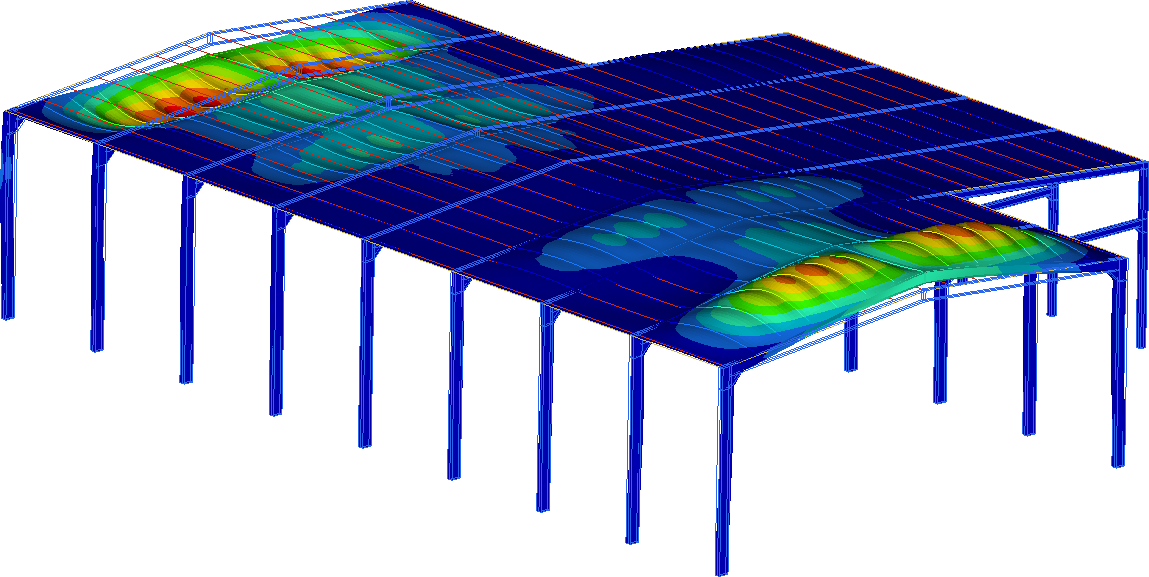
Initially, we studied the natural frequencies of the structure. We can see the first four natural frequencies in the figure below.
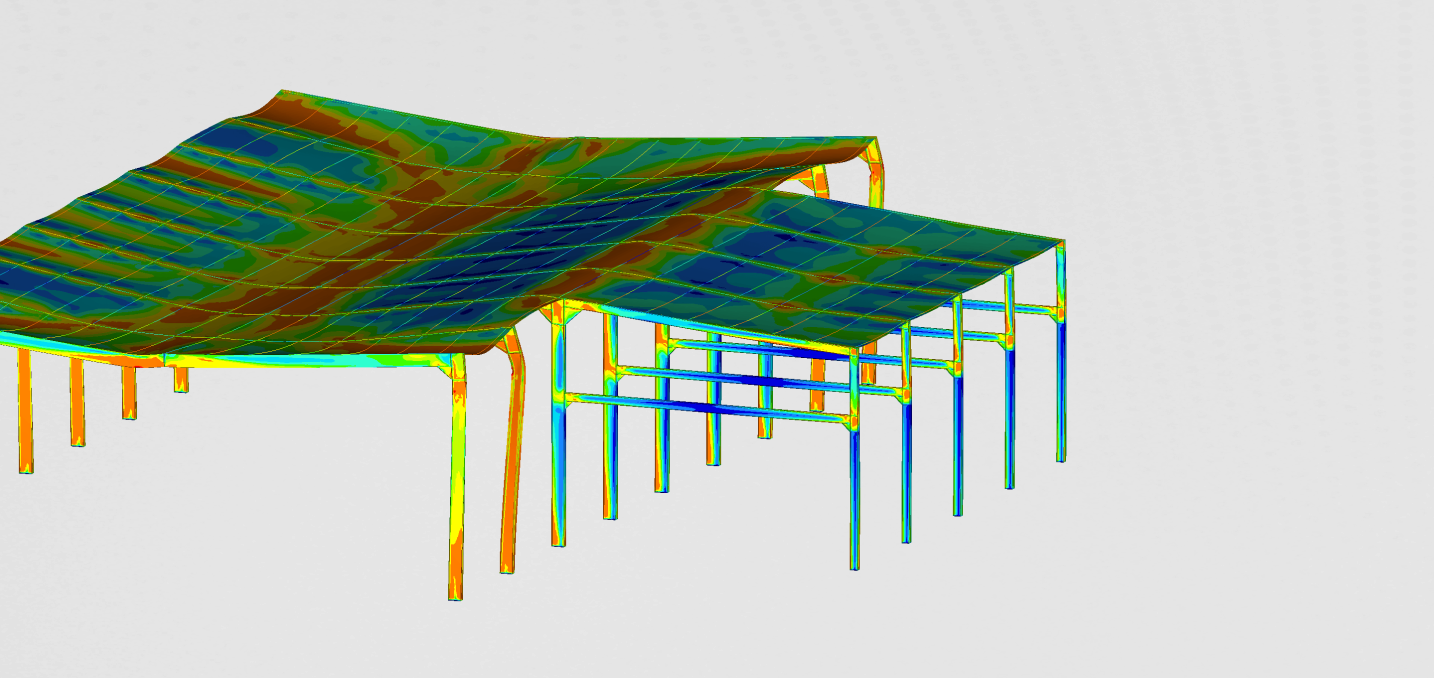
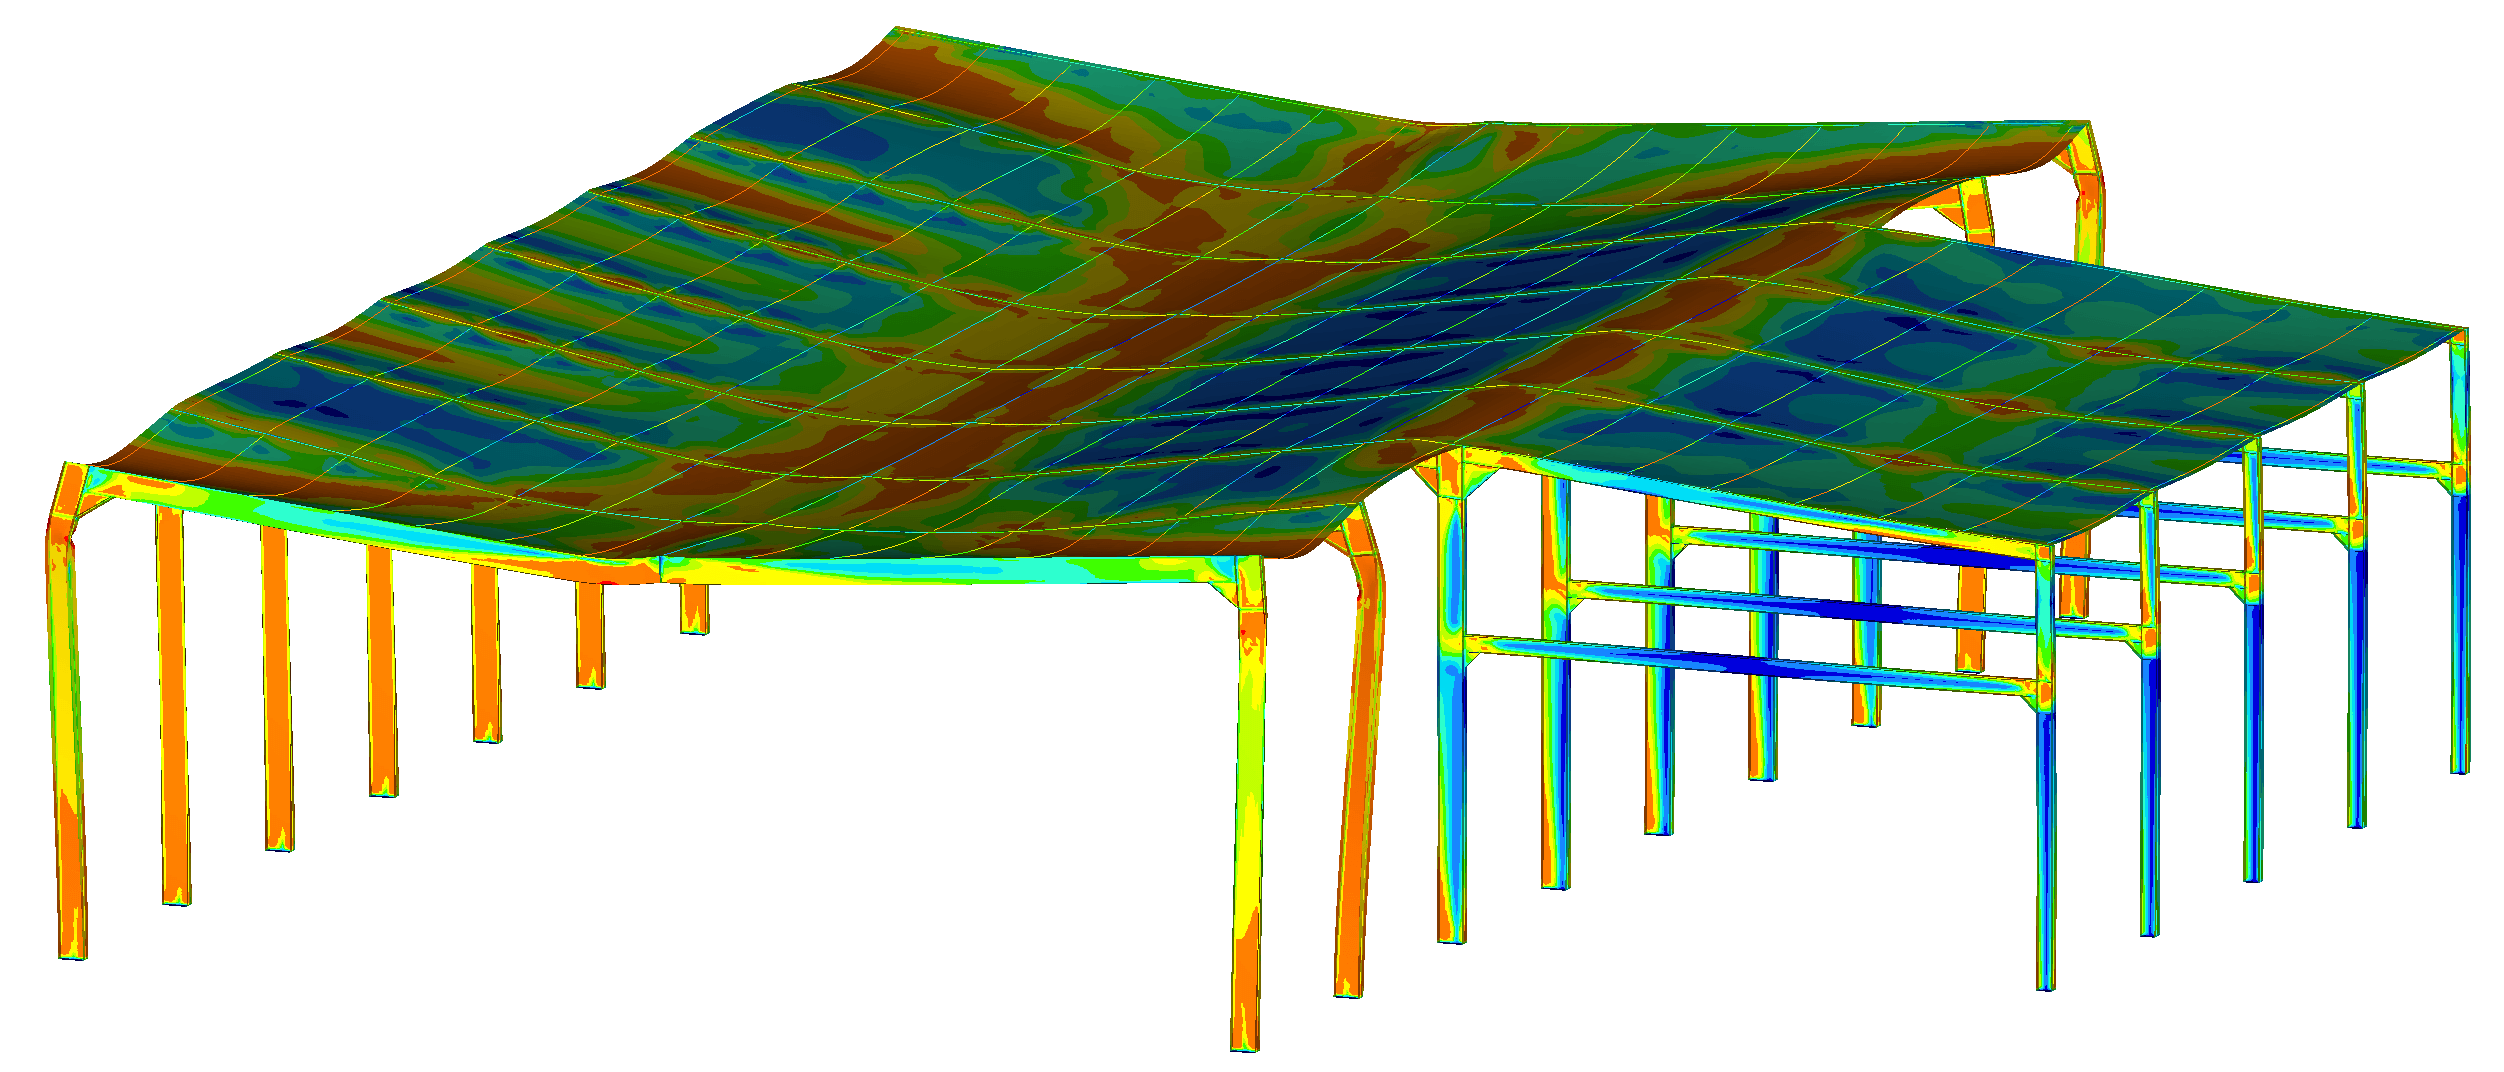
TRANSIENT ANALYSIS
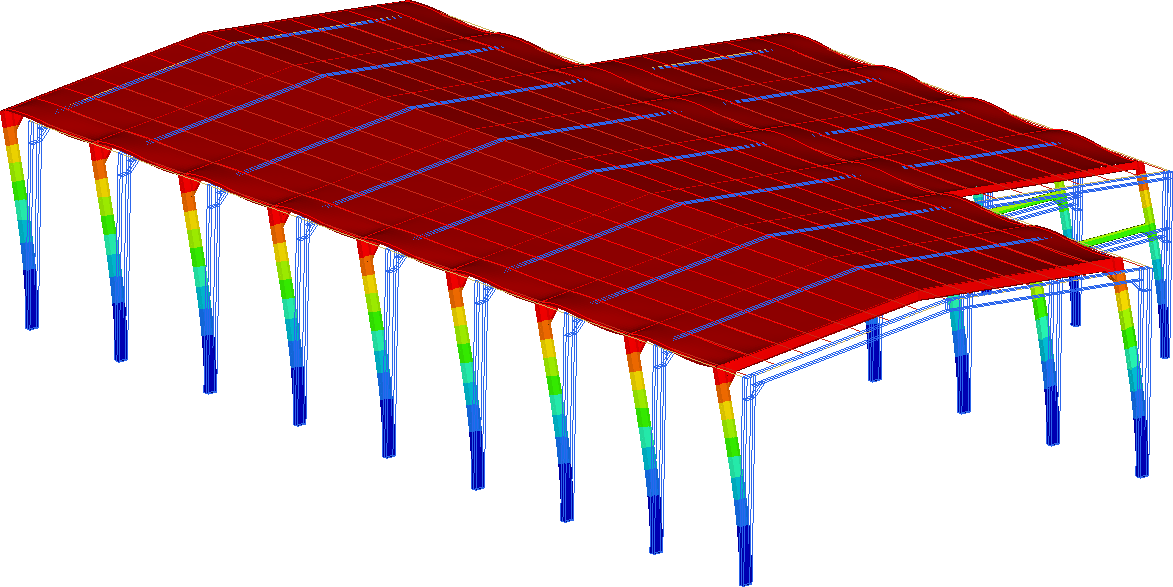
This transient analysis gives us a good representation of the dynamic behavior of the structure during the earthquake. We can see how the structure vibrates with a combination of natural frequencies. Postprocessing enables us to look for peak stresses, strains, and displacement.
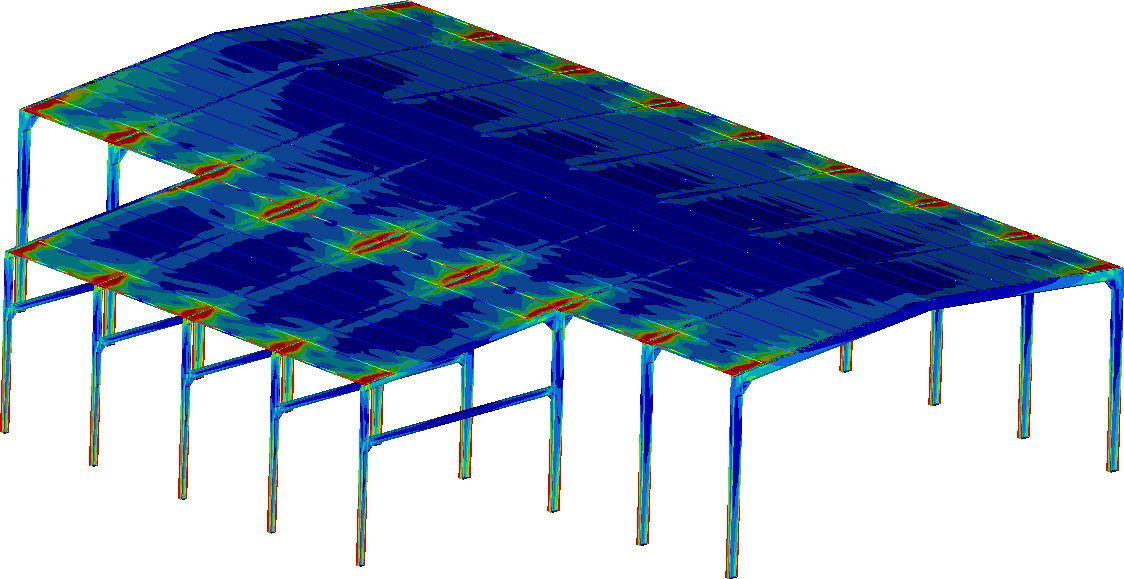
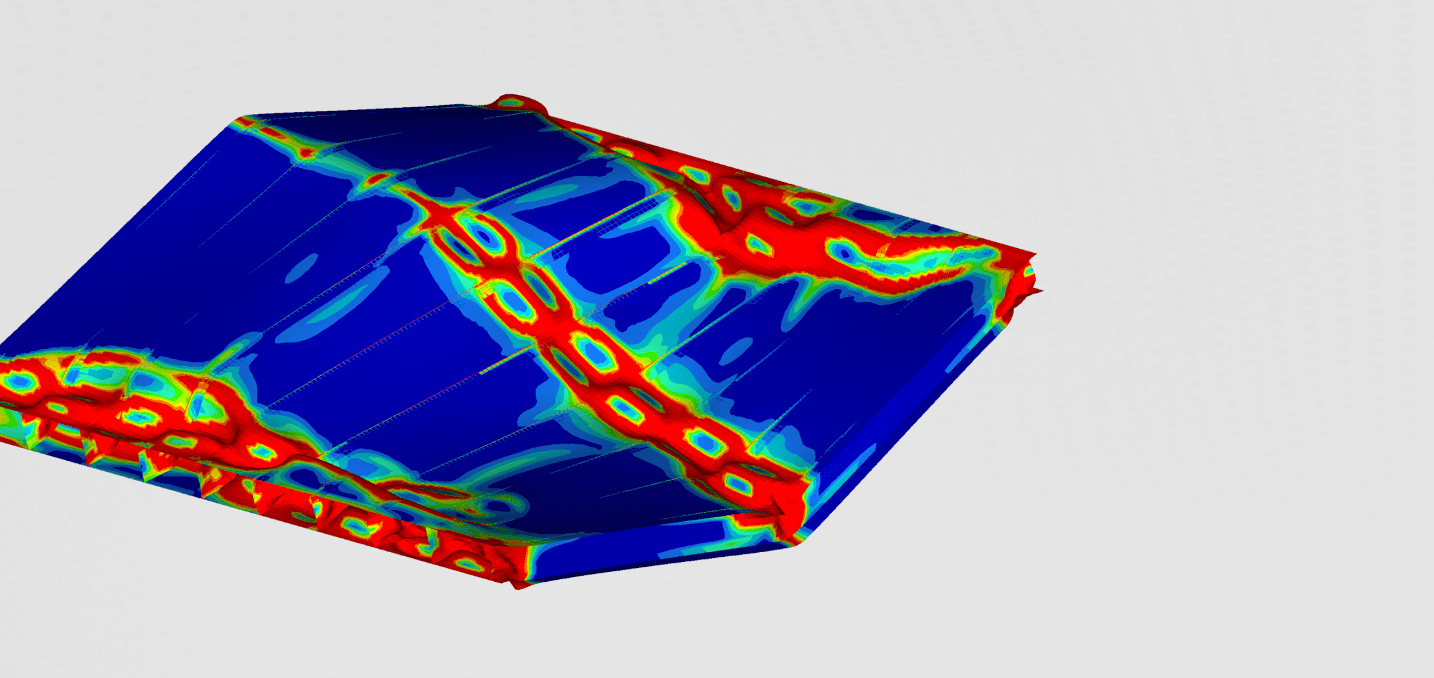
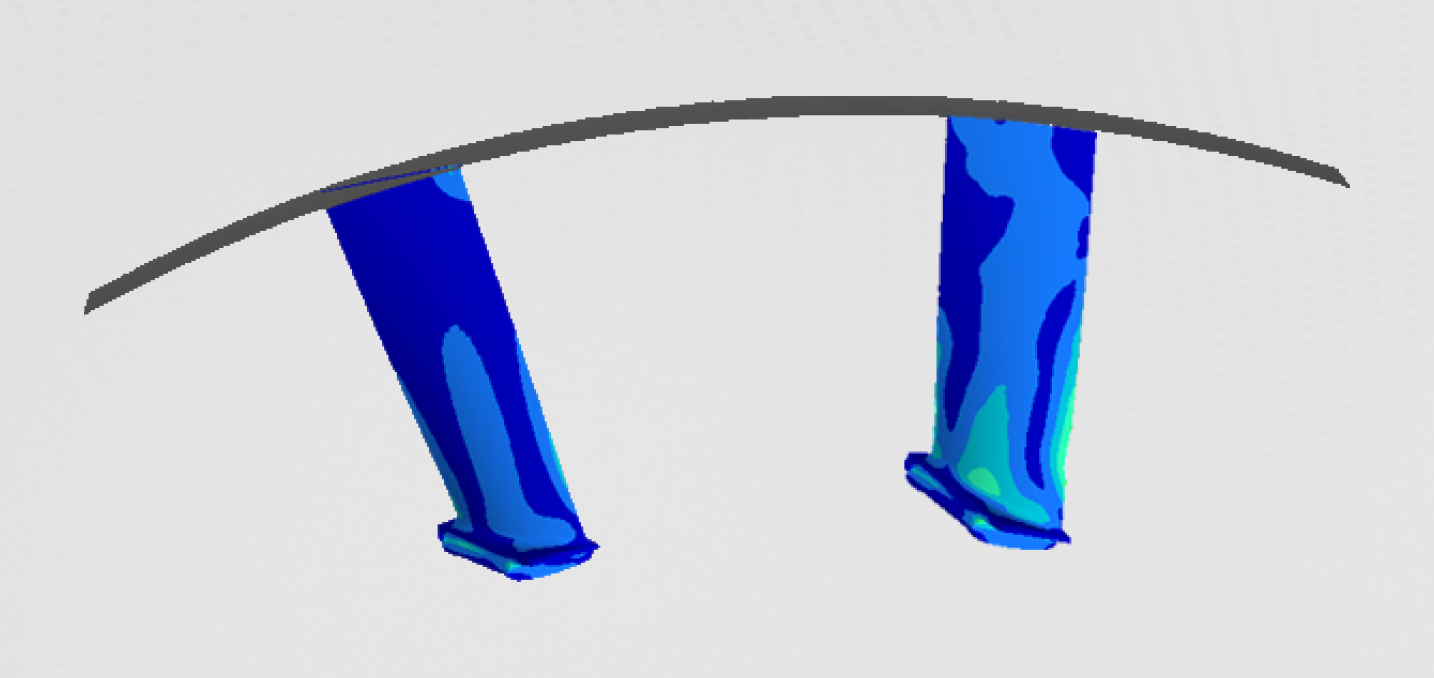
STATIC ANALYSIS
The finite element model was also used for the nonlinear static analysis, representing a large amount of snow falling on to the roof. We can observe the buckling collapse of the structure on the figures below