Introduction
In recent years, driving comfort has become one of the key aspects of the automotive industry. Noise, vibration, and harshness (NVH), together with Ride and Handling, Impact and Crashworthiness, Durability, NVH builds up four most important aspects of the modern vehicle design. Manipulation of NVH starts very early in the design cycle of the vehicle and therefore relies largely on the use of numerical simulation. Since harshness is to some extent subjective quantity, we have mainly concentrated on vibration and noise.
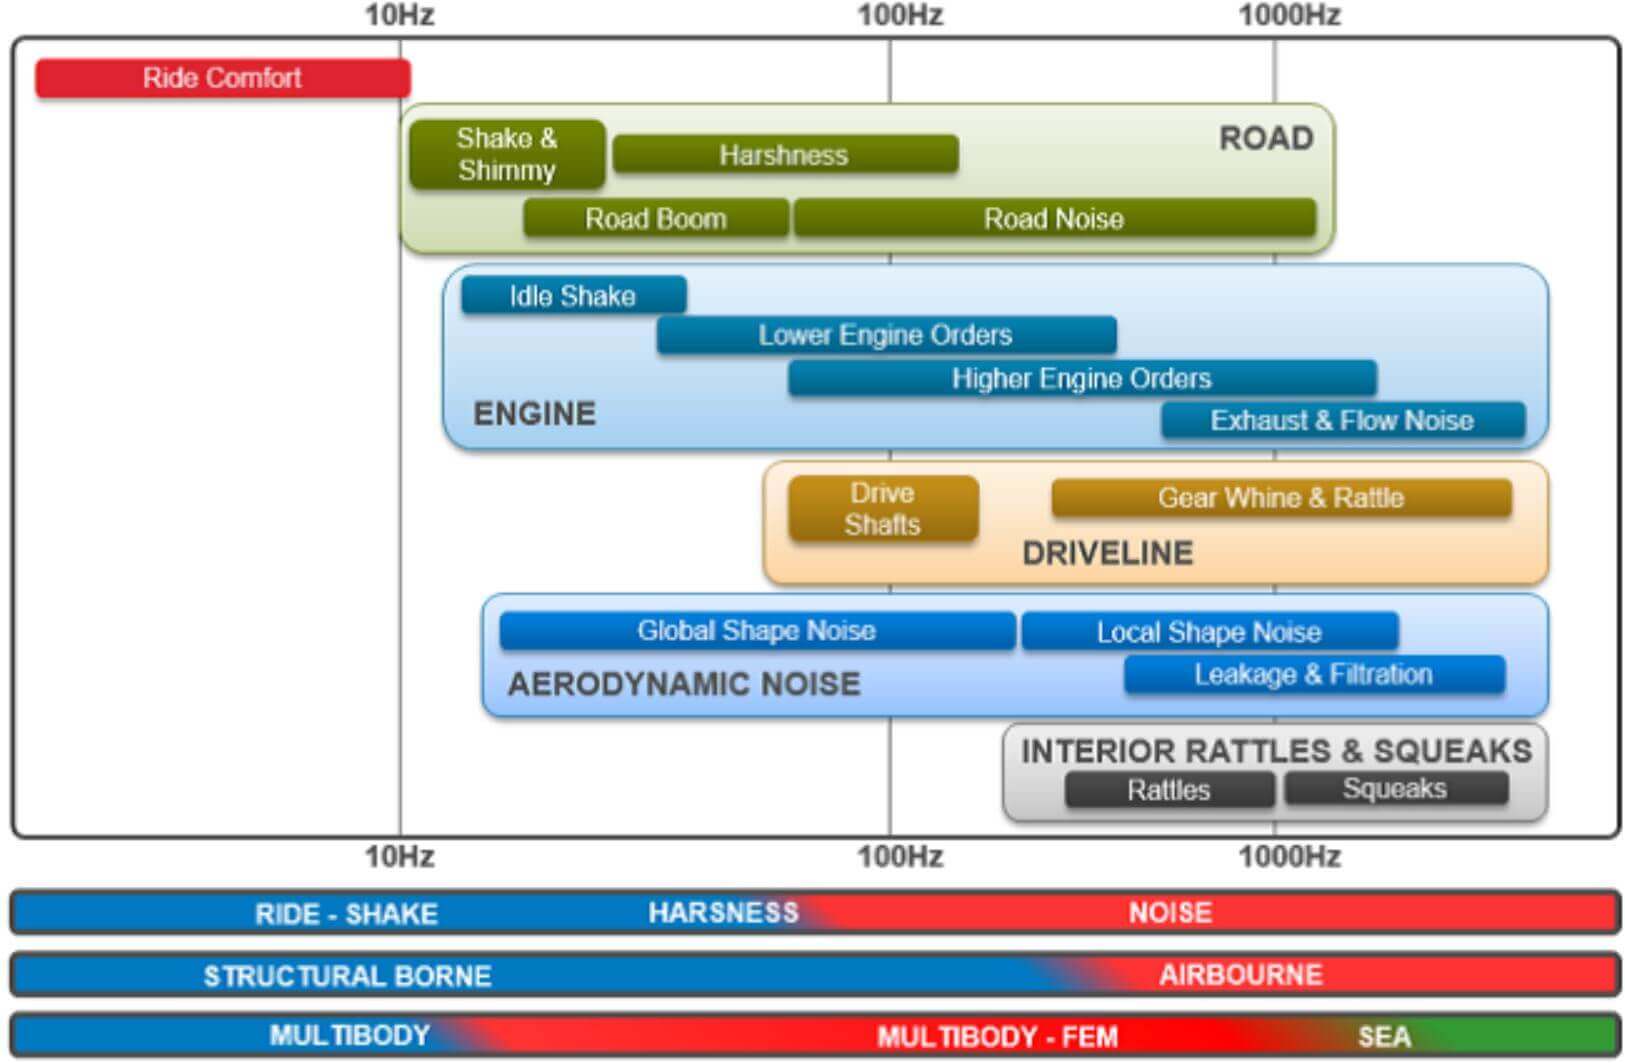
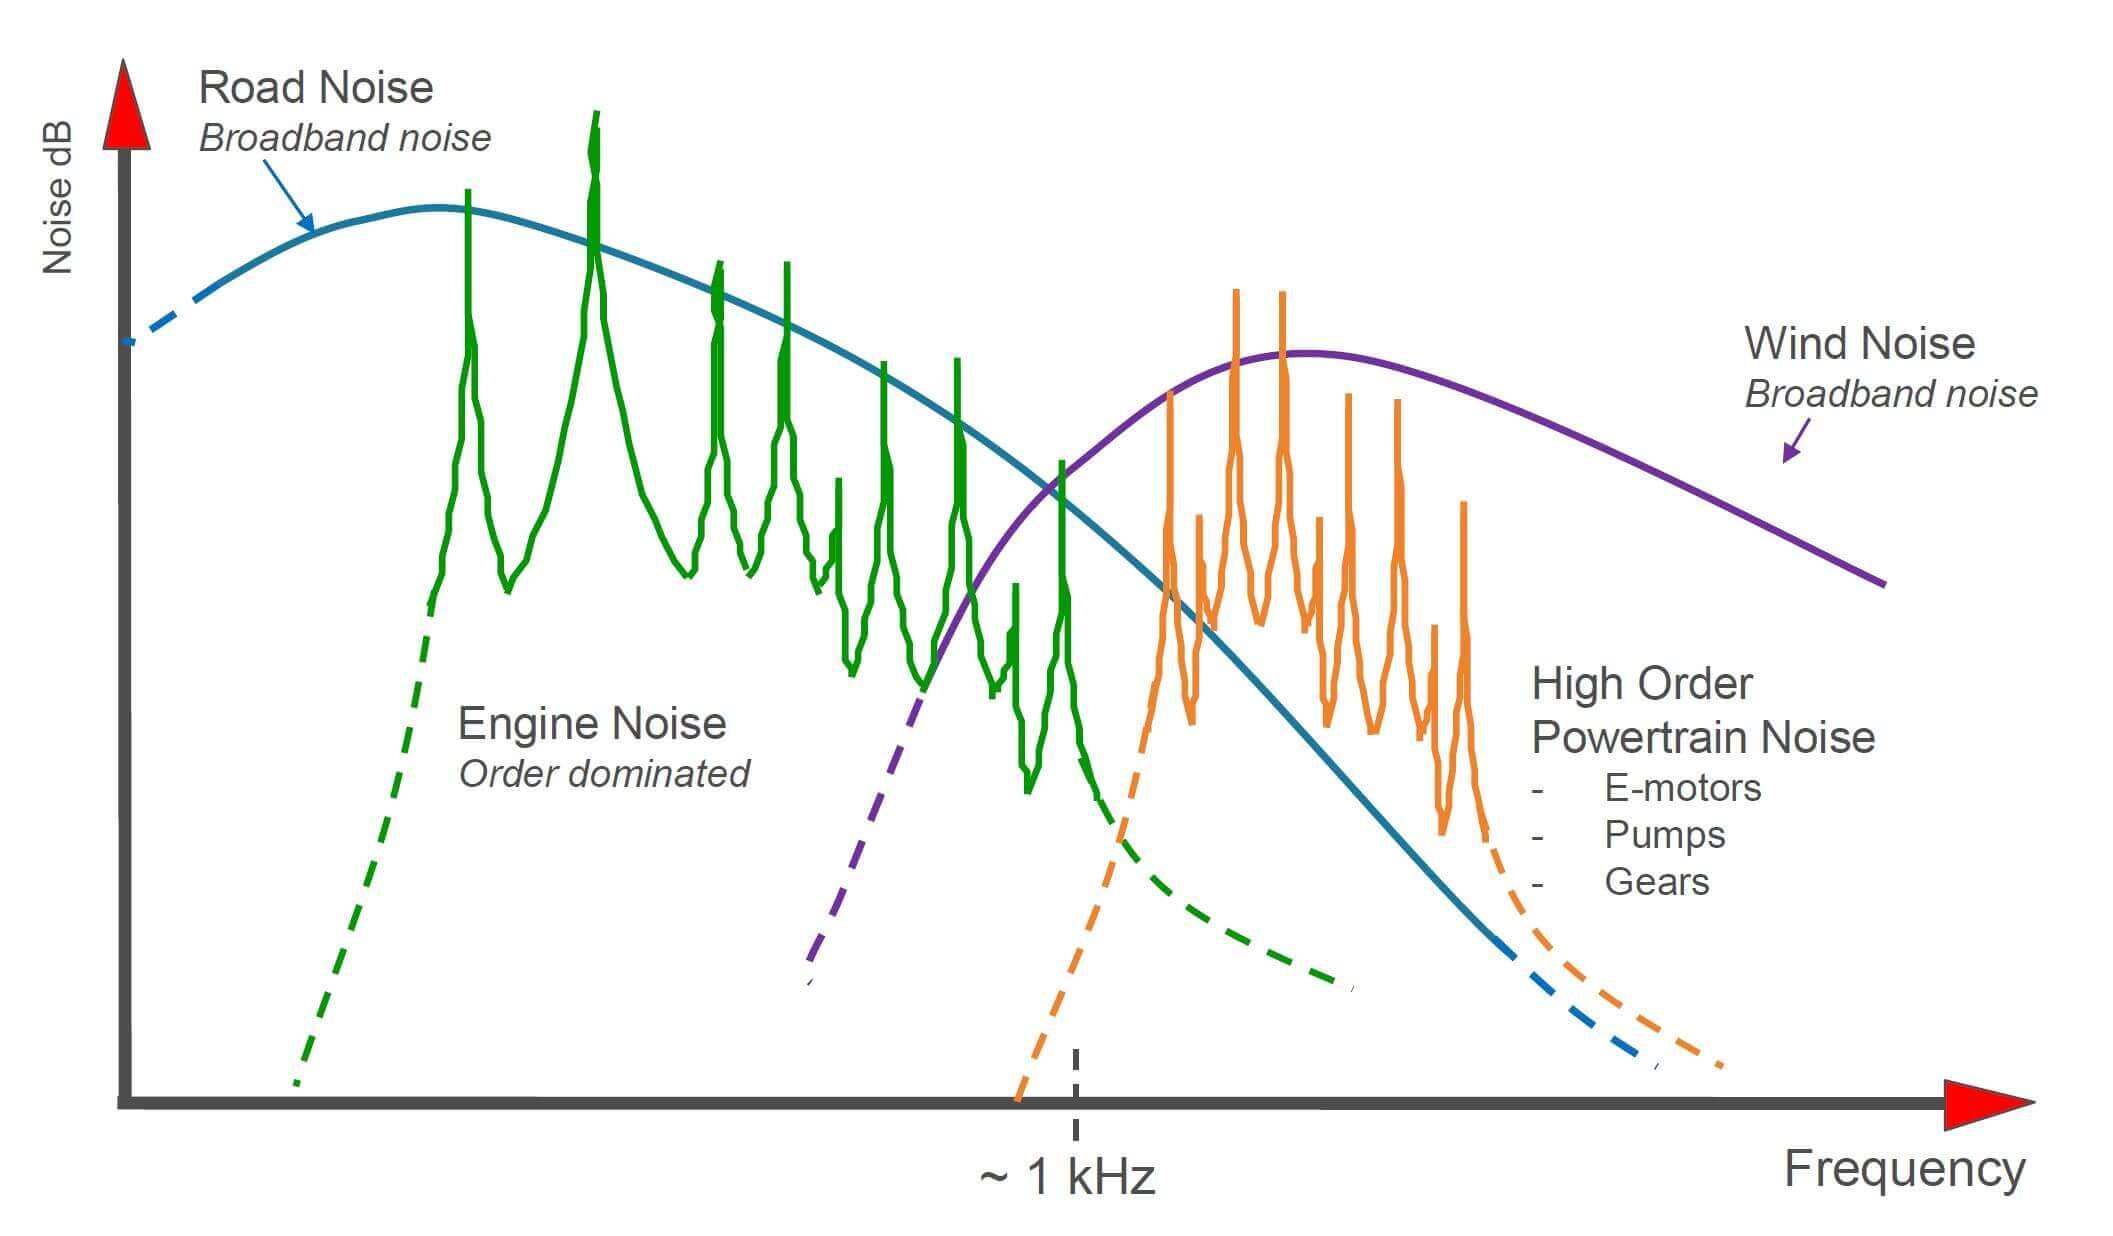
Sources of vehicle noise can be classified in three main categories; Mechanical noise, Aerodynamic noise and Electrical noise. We pointed our interest only to the Mechanical noise within this case study. Further classification divides noise to interior (cabin) noise and exterior noise. Interior noise is experienced by the driver and the passengers, while exterior noise accounts for the noise radiated to the surrounding of the vehicle. This noise is often associated with the "drive by" noise testing. From the frequency spectrum, the vehicle NVH can be divided as presented on Figure 1.
Simulation methodology
The bases of all NVH lies in the natural frequencies and mode shapes of the vehicle, which are two attitudes associated with all components. Since modal analysis is linear perturbation method, it is relatively robust and computationally manageable even for structures as complex as vehicles. Following the modal analysis, frequency response of the vehicle, under certain external load, is often required. Knowing which part of the vehicle vibrates, with what amplitude and at which frequency, gives us a valuable insight on the overall NVH characteristics.
As an extension of the frequency response, interior noise simulation was performed. This meant adding an acoustic medium inside the passenger cabin and observing the noise pressure lever at desired locations within the cabin. Finally, the model was upgraded with the radiated sound analysis, simulating the exterior noise radiated to the outside of the vehicle. In summary, the work flow looks as such:
- Modal analysis for the vehicle chassis assembly
- Frequency response of the vehicle under the engine excitation loads
- Interior noise simulation with acoustic-structural interaction
Geometry and mesh
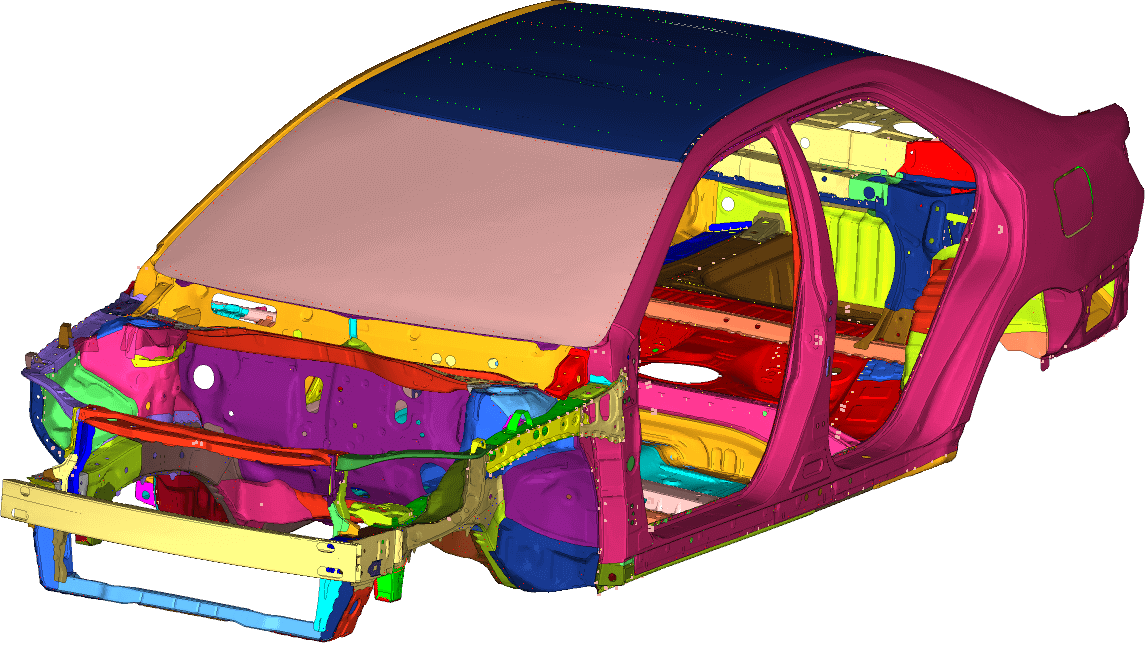
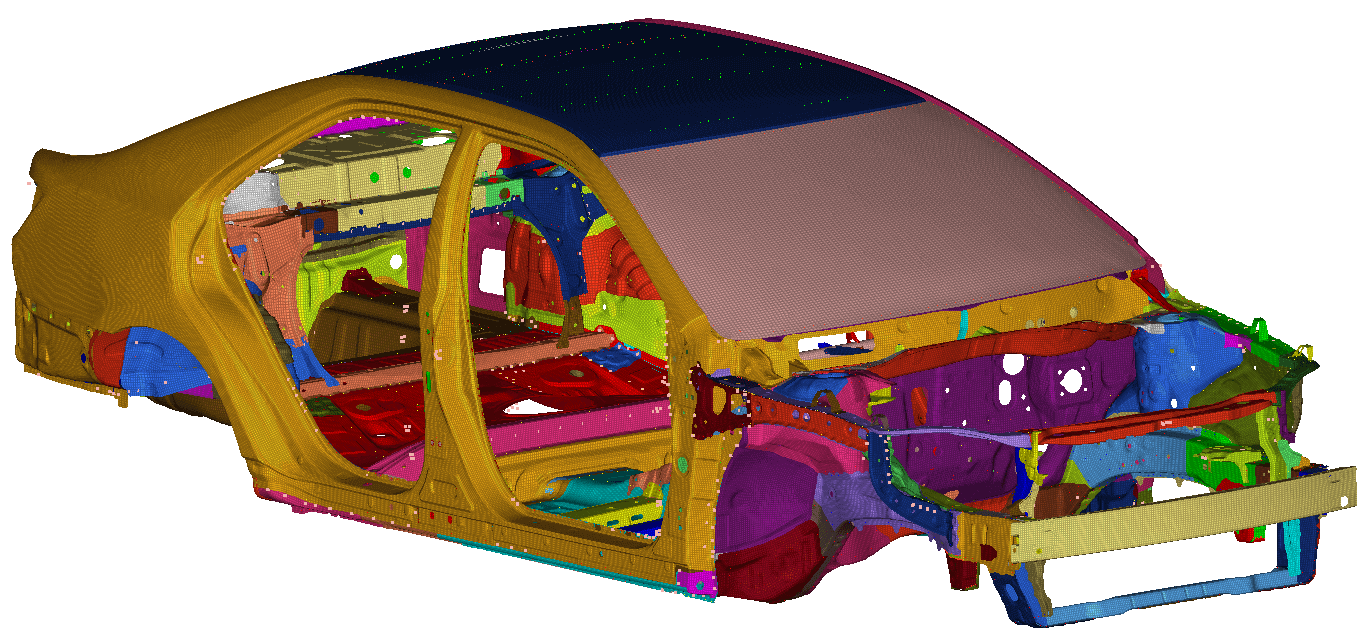
The model of the vehicle was made on the family saloon. It contained all the most important parts of the chassis together with some added covers and panels. Altogether, the model consists of more than 300 components. Since all of them are made of sheet metal, the components were meshed with shell elements with associated material properties and thickness. Since all the simulation procedures used in this case study are linear, there was no need for advanced material characterization.
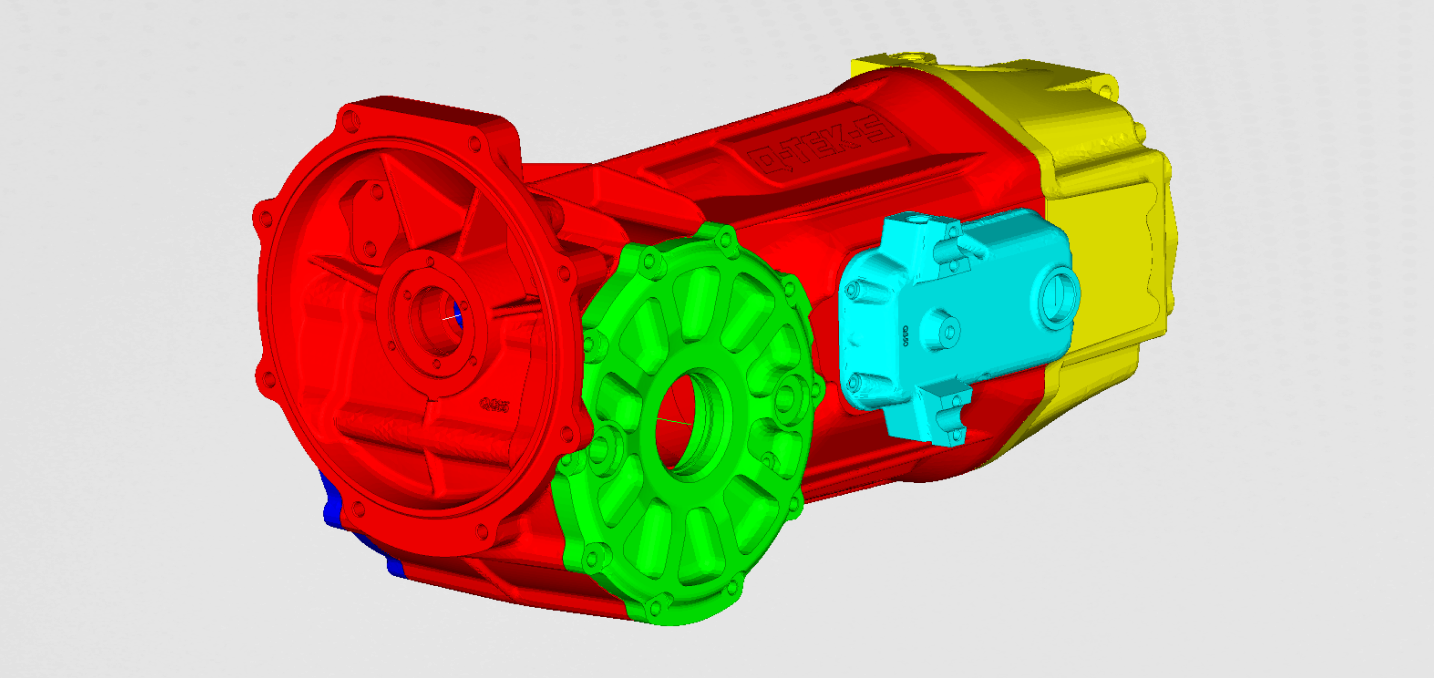
Majority of the components of the chassis were connected with spot weld. This type of welds were approximated with either beam or rigid elements. Additional mass, such as mass of the engine, was added as a point mass at the center of gravity of the engine and connected to the engine mounting panels.
For the purpose of the acoustic-structural simulation, the interior of the vehicle needed to be filled with the acoustic medium. It is very important to choose the right element size of the acoustic medium, since we always want to find the compromise between the computational expanse and the accuracy. The rule of thumb for the largest acoustic element is to have at least 10 to 15 elements within one sound wave length.
This means that by increasing the highest frequency of interest, we will not only have to calculate more natural frequencies and frequency responses, but will also have to decrease the maximum element size inside the acoustic medium.
Loads and Boundary conditions
The analysis set up was divided into roughly 4 parts regarding methodology of the simulation. The first one was the modal analysis, where the structure was not constrained in any way, and the frequency of interest was set up to 500 Hz. It can be seen from the Figure 1, that this frequency range corresponds to the excitation of the lower engine orders. This frequency range gave us a chance to study some global chassis mode shape as well as some higher orders of the larger thin walled panels like roof or windows.
For the second stage of the analysis, where frequency response analysis was performed, the engine excitation was added to the model. The excitation force of the engine assumed only the contribution of lower orders. This force was applied in the center of gravity of the engine and connected to the attachment points of the engine on the chassis.
For the interior noise analysis, we needed to add the acoustic cavity mesh to the vehicle model. Similarly, for the external noise analysis, the outer shell was added for the purpose of calculating the sound pressure.
Results
Modal Analysis
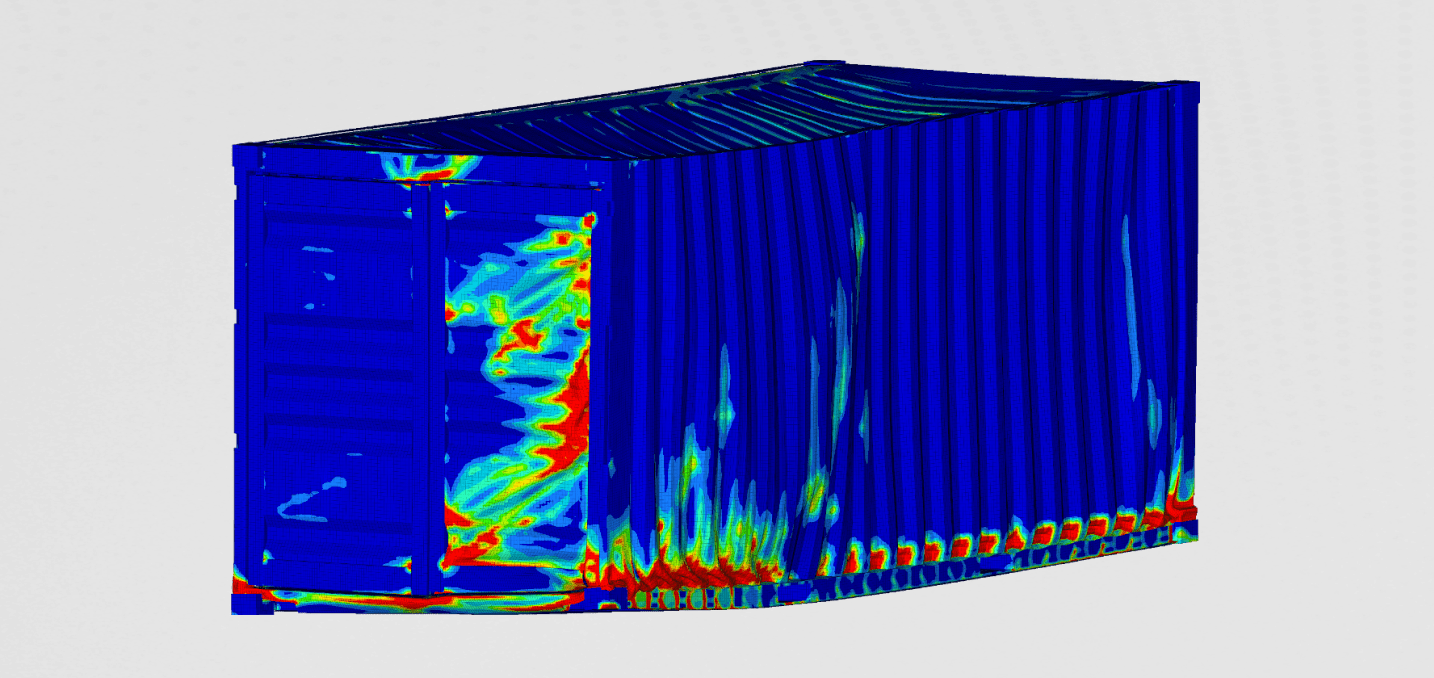
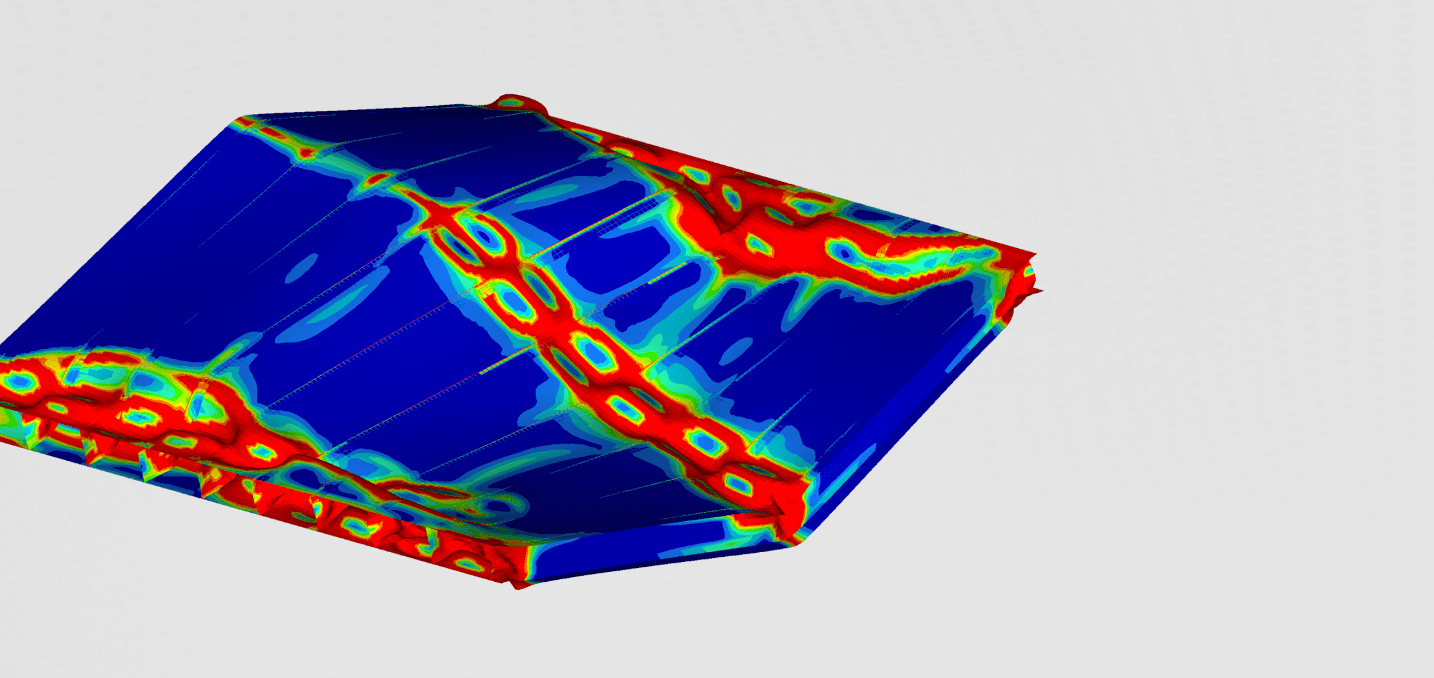
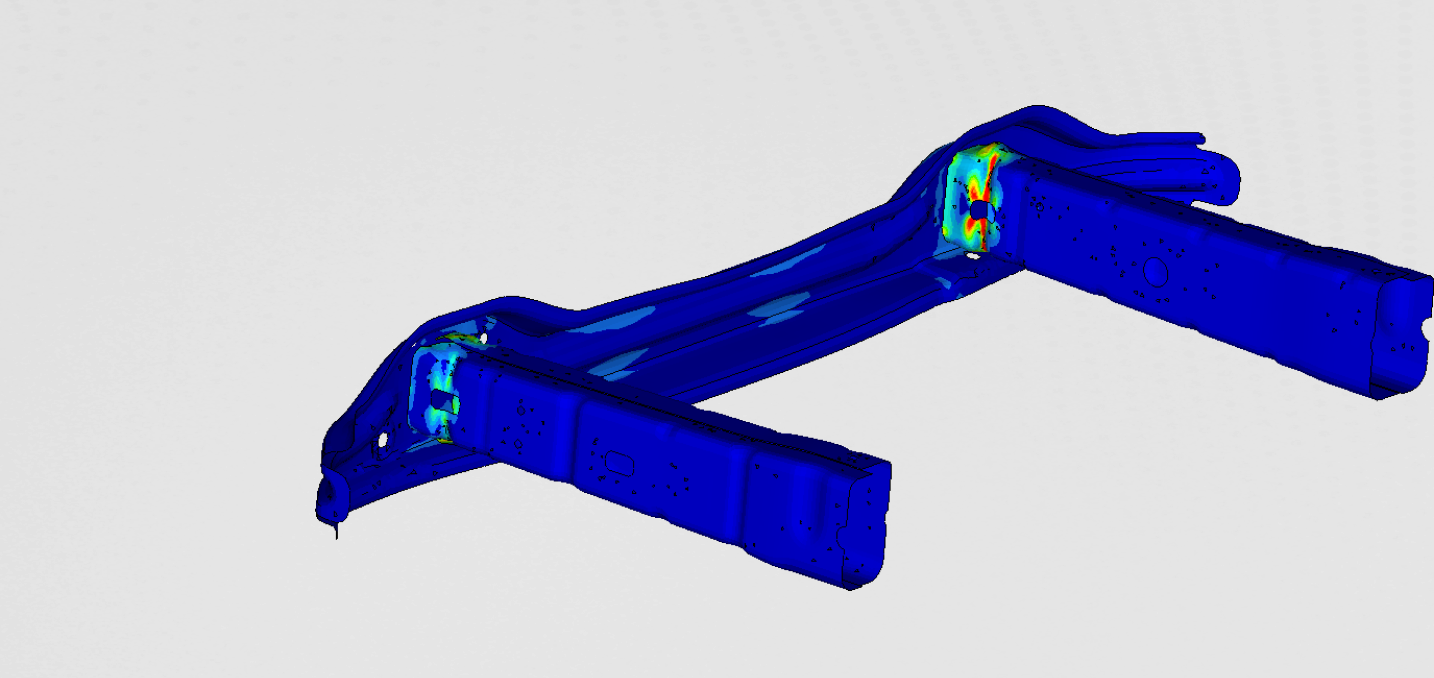
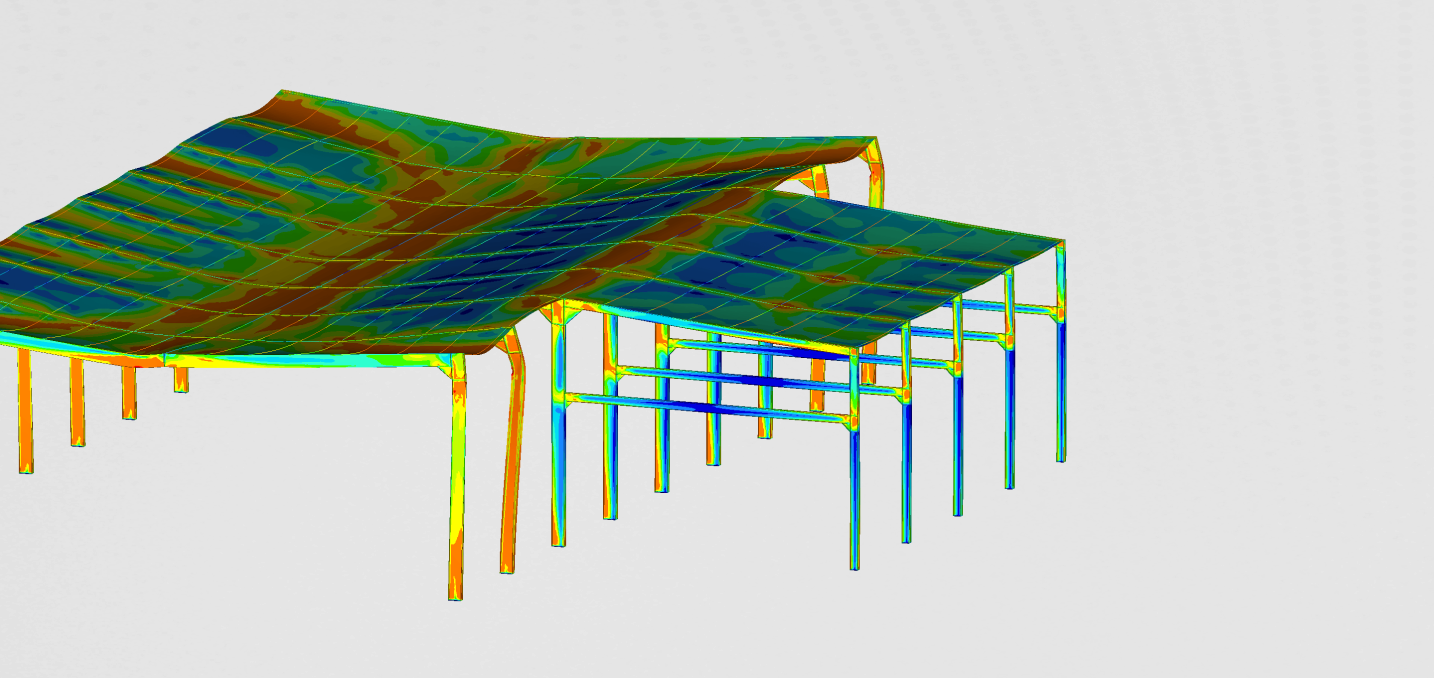
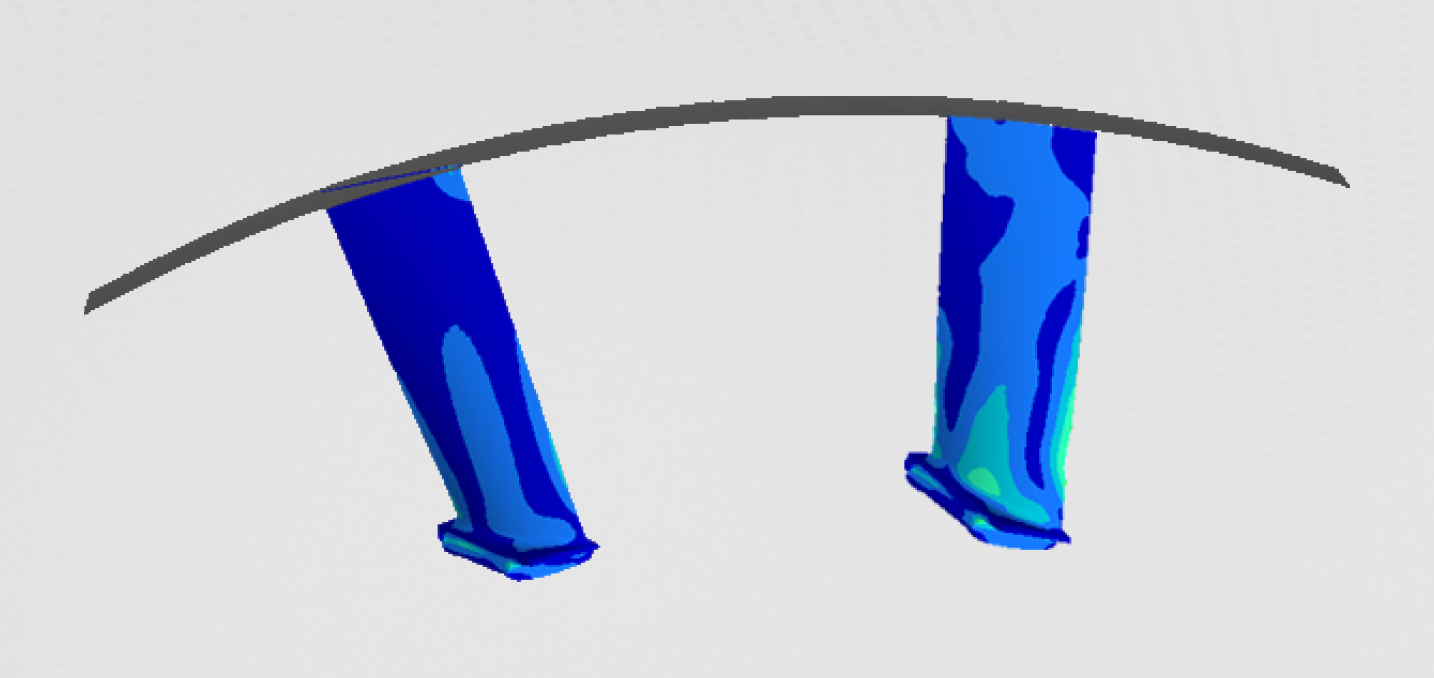
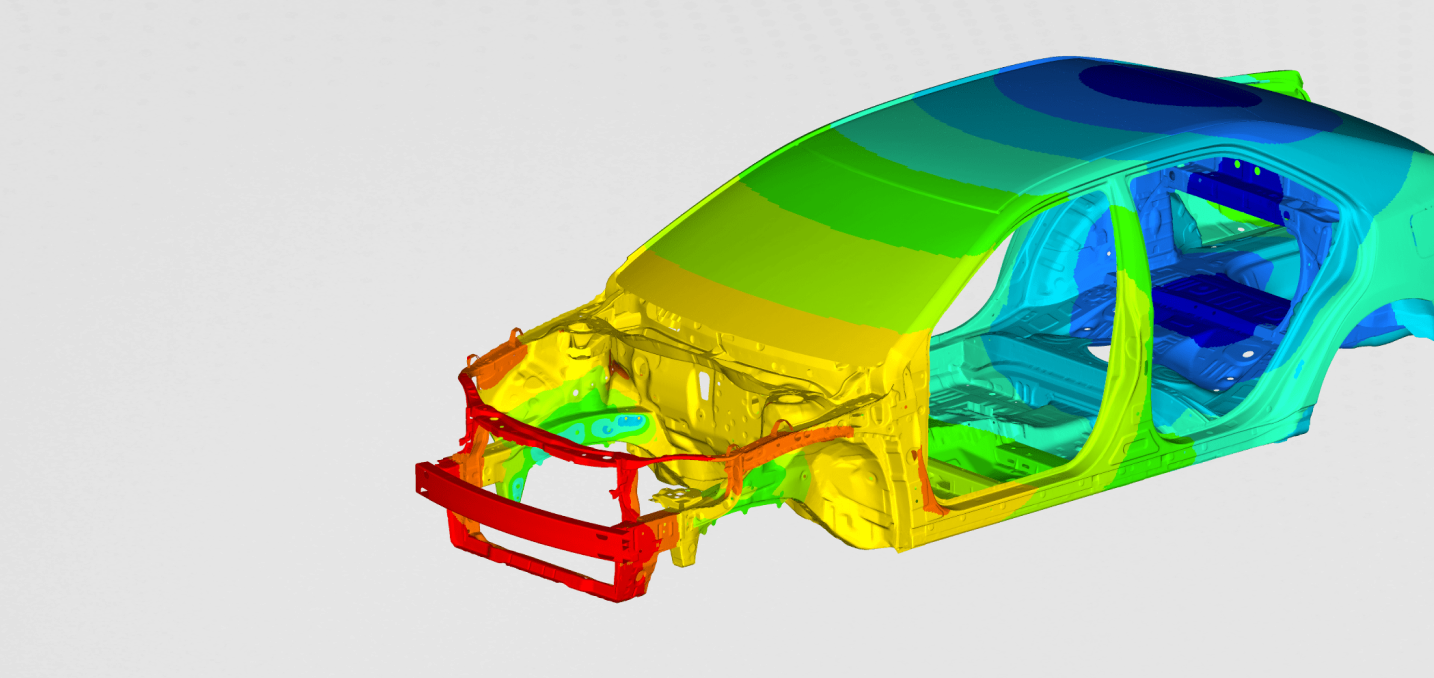
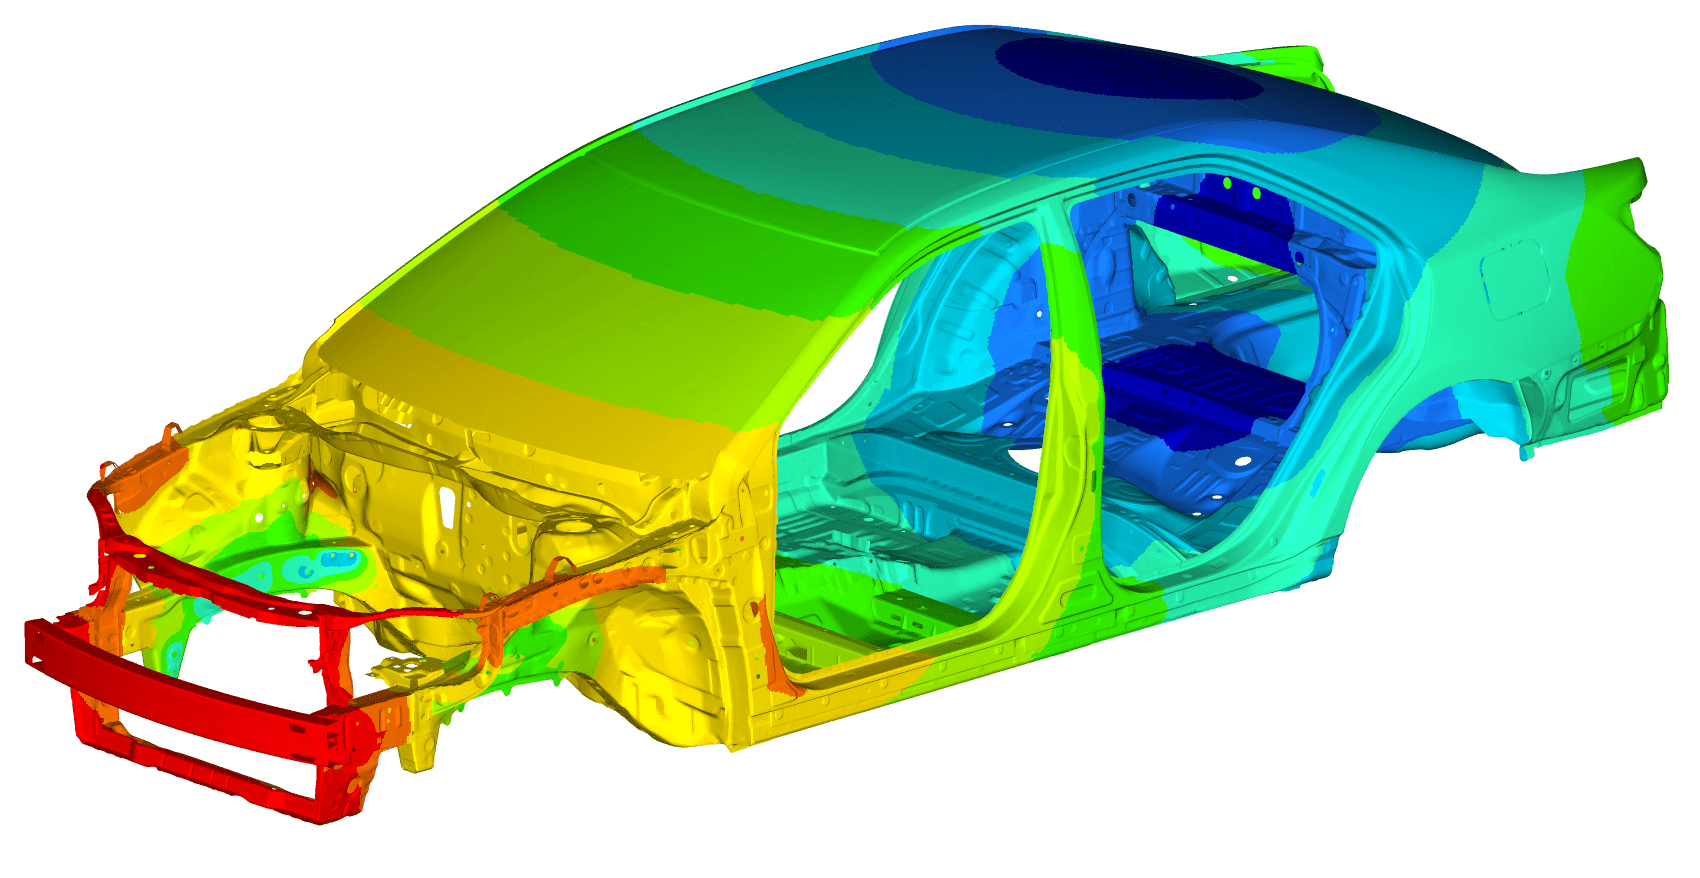
Since modal analysis is the basis for all further analyses, it is important to look closely to the most important natural frequency, which would later influence other NVH aspects. On the figures below, reader can see global and local mode shapes.
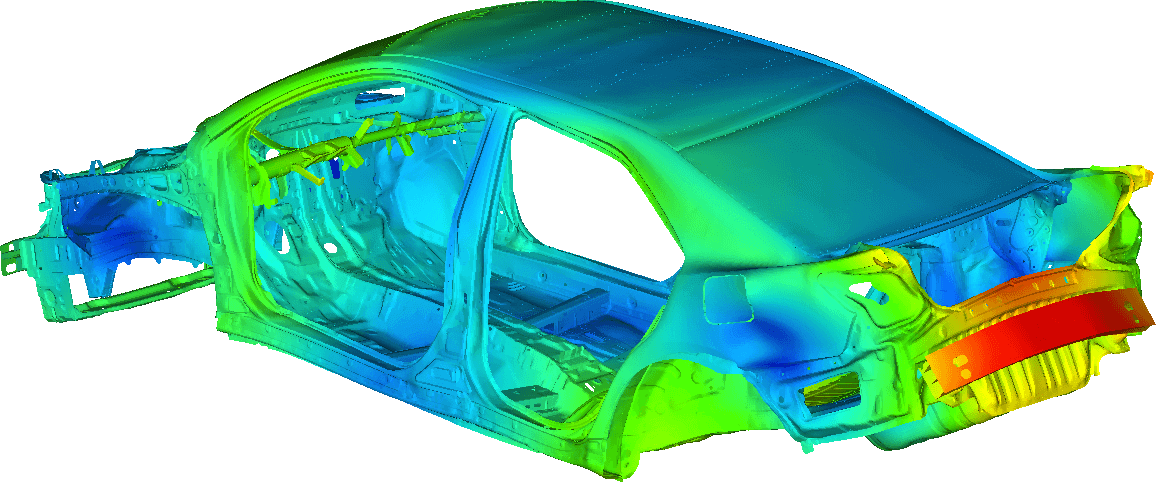
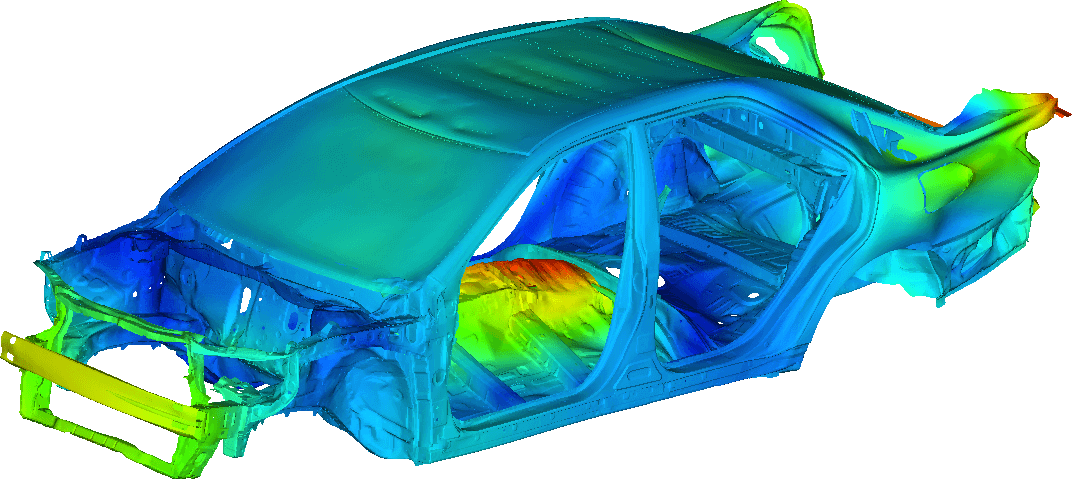
.png)
Frequency response
The results of the frequency response can give us a good insight into the overall NVH performance. Considering the NVH is especially important for the riding comfort, the vibration was monitored on the parts where the seats are mounted. The frequency response is presented as the displacement of the observed node in the frequency domain.
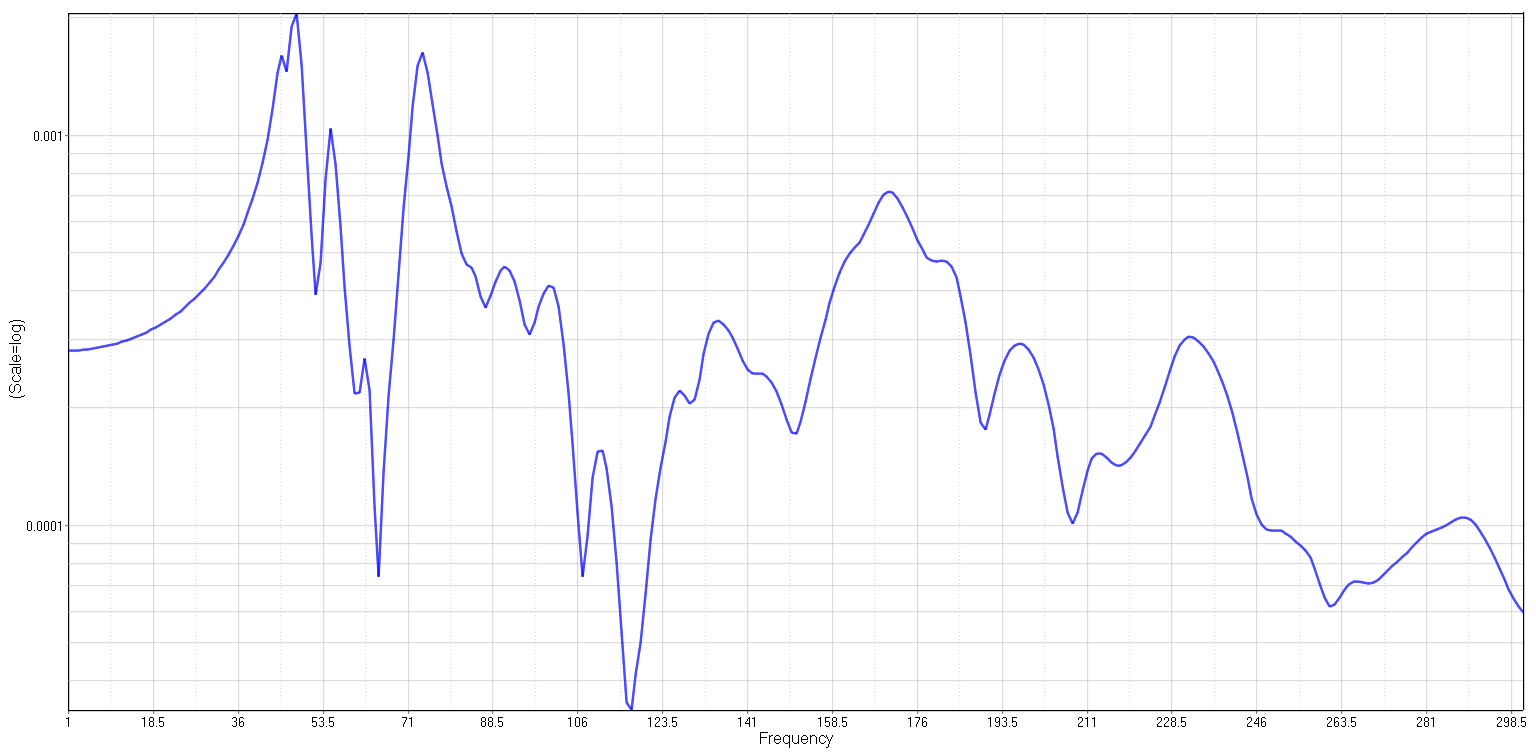 Figure 7: Frequency response at the seat attachment
 .png) Figure 8: Modal participation factors at frequency f=47 Hz
Figure 8: Modal participation factors at frequency f=47 Hz Interpretation of the frequency response function for such complex structure can be very challenging. As the structures get more complex, they increase the number of possible degree of freedom and with that, the number of natural frequencies increases as well. This makes it harder to evaluate the influence of a certain natural frequency to the overall response.
To have a clearer picture of which mode influences the response the most, at a certain excitation frequency, we plotted the graph of the Modal Participations. This graph delivers the information of how most influential normal modes contribute to the overall response.
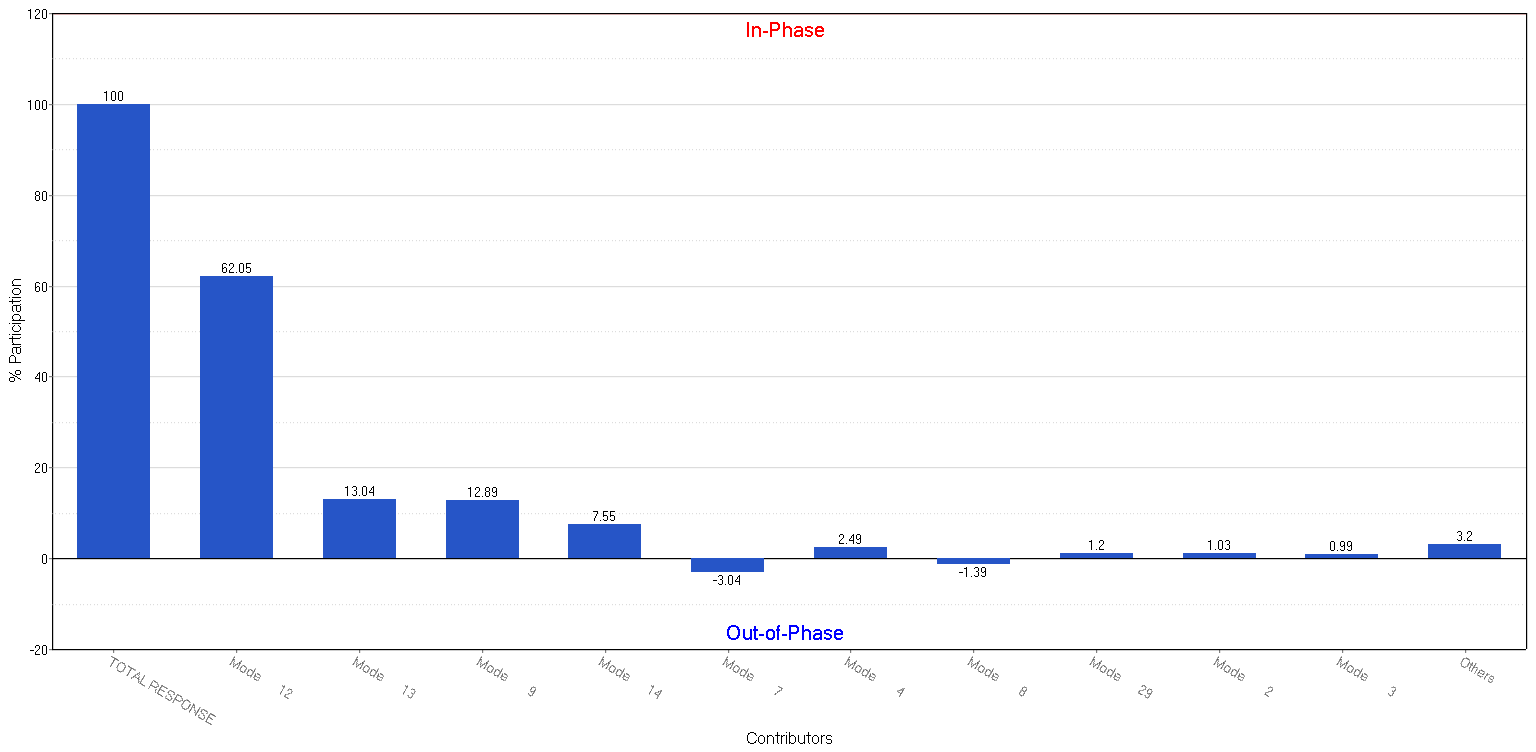 Figure 9: Modal participation factors at frequency f=74 Hz
 .png) Figure 10: Modal participation factors at frequency f=168 Hz
Figure 10: Modal participation factors at frequency f=168 Hz Looking at Figure 8 and 9, most influential natural frequencies are clearly represented. At 47 Hz the modal participation of the second natural frequency is 58.2% of the overall response and at 74 Hz it is the 12th mode that contributes to the overall response with 62.05%.
As the frequency increases, the normal modes occur even closely to each other. This can be seen on Figure 10, where the modal participation to the overall response is a lot more evenly distributed among the natural frequencies. This makes it a lot harder to identify the most influential natural frequencies and later optimize them in order to decrease the overall response.
Another very convenient way of analyzing the frequency transfer function, is to plot the FRF for each frequency together with the overall response. This graph can be seen on Figure 11 and 12.
Cabin noise level
This last section is dedicated to the investigation of in-cabin noise level. This is more or less just an extension the frequency response analysis. The noise at the certain location is measured as sound pressure. Below, the sound pressure level at four different locations, corresponding to 4 people sitting inside the vehicle, can be seen.
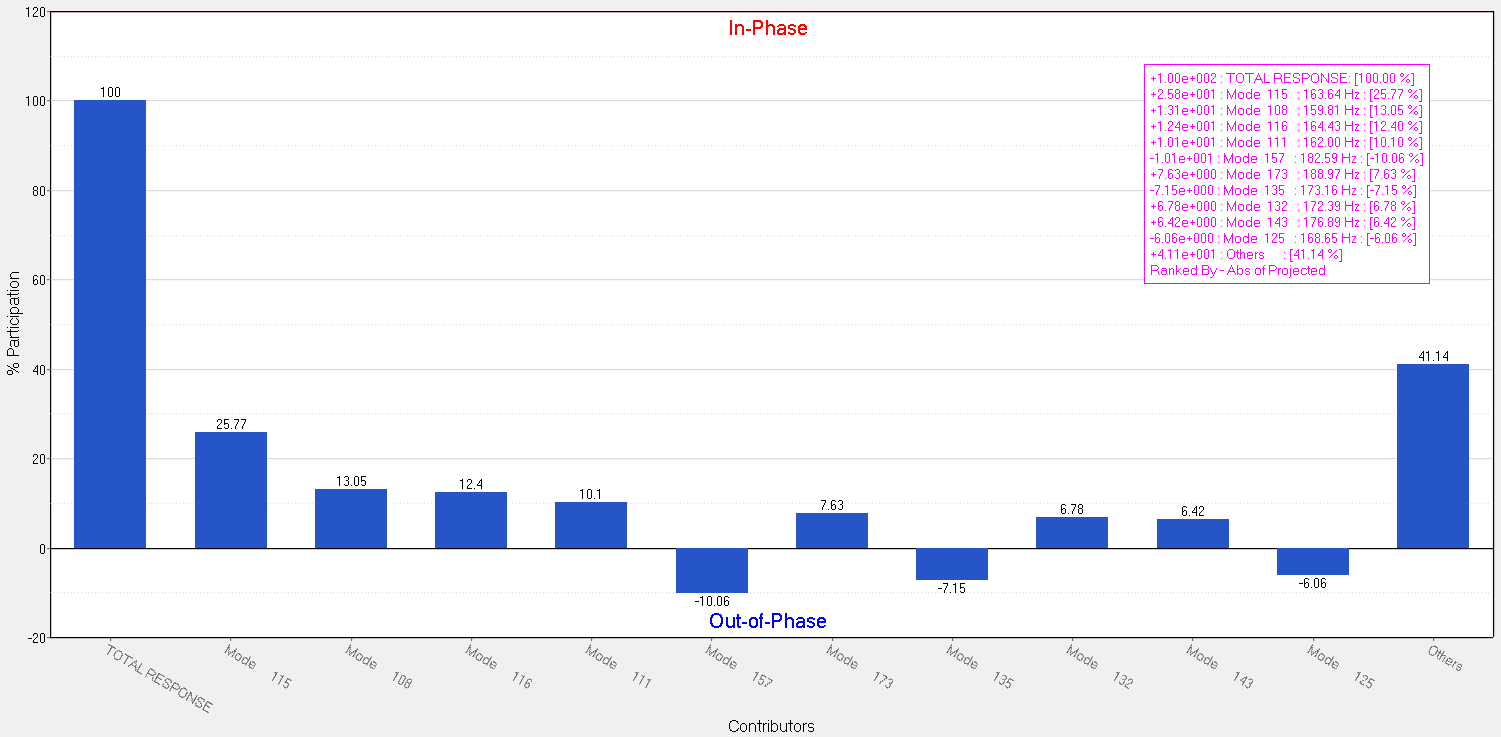 Figure 14: Sound pressure level at the location of each passenger
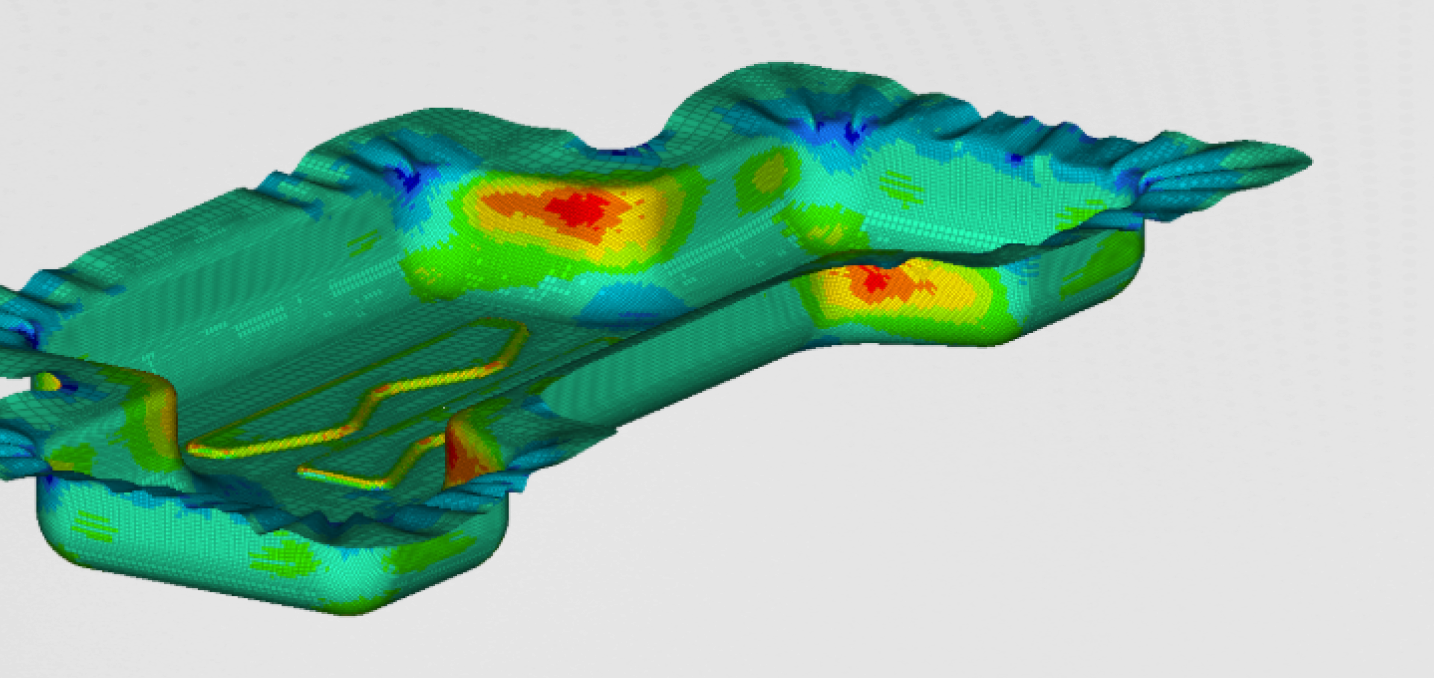
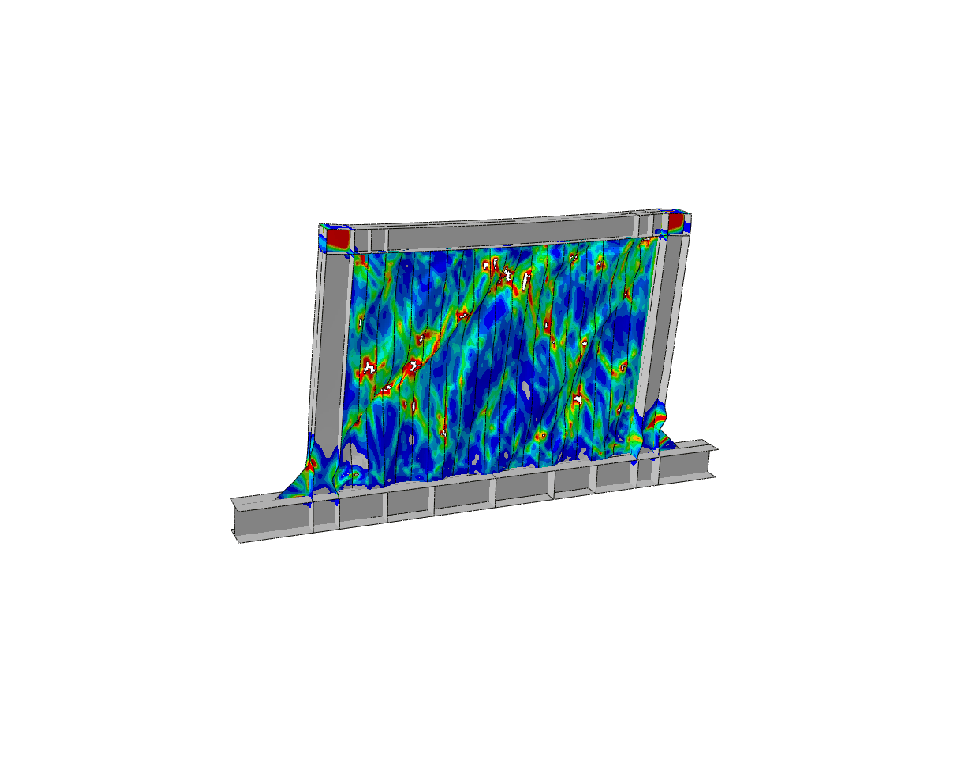
 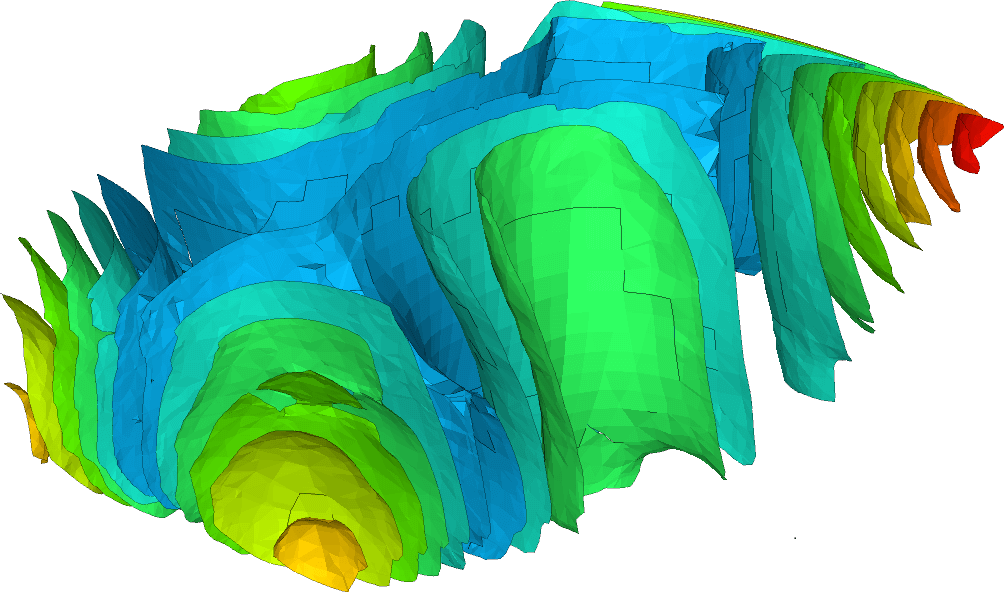 Figure 15: Sound pressure level inside the cabin at f=168 Hz
 From Figure 14, the noise level inside the cabin can be seen. The loudest peak appears at 168Hz. The sound pressure distribution at this frequency can be seen in Figure 15. In Figure 6, we can see the dominant mode shape.