Introduction
With the ever-increasing number of electric vehicles on the market, the need for the design and optimization of electric motors has grown significantly. There has been a noticeable shift for the induction machines to permanent magnet synchronous machines (PMSM). The reason for that lies in higher efficiency, compact design, higher torque density, and easier motor control.
The performance in the PMSM is usually limited by temperature. Some of the vital parts of the PMSM, like magnets and winding coating, have a very strict temperature limit. When this temperature limit is breached, the component starts degrading faster or even losses its physical properties. In this case study, we will demonstrate the workflow for PMSM thermal analysis.
The analysis is split into two parts: Initially, the electromagnetic analysis was performed and the main sources of thermal losses were calculated. We considered losses in all key components like rotor and stator lamination, winding and magnets. These thermal losses were later used in the thermal analysis. Both solid heat transfer and computational fluid dynamics were considered in the thermal analysis.
Electromagnetic analysis
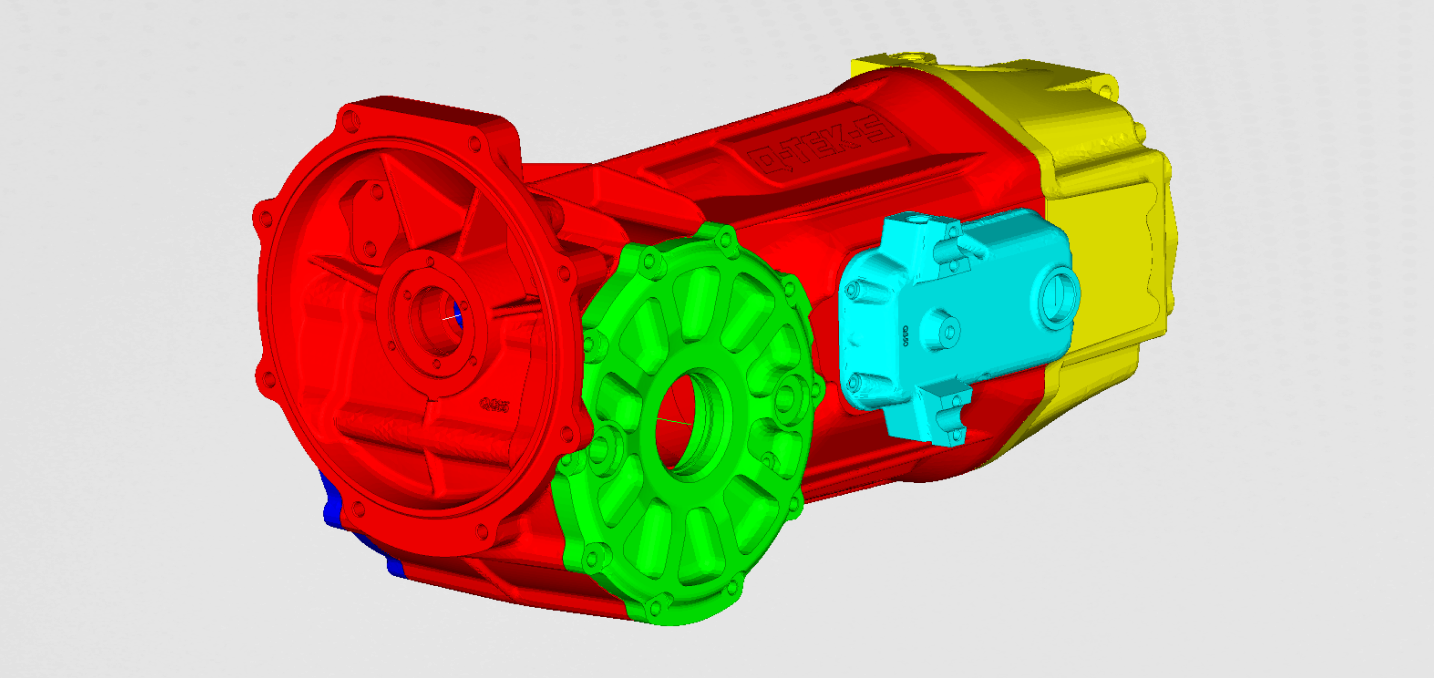
In Figure 1, the reader can see the outer casing of the E-motor. Since this is only the demonstration of the thermal analysis, the shape was simplified. For the electromagnetic analysis, the cross-section through the active part of the motor was extracted.
.png)
.png)
.png)
For the thermal analysis, we were interested in the performance of the motor at the “corner point”. Prior to the electromagnetic losses calculation, the corner point needed to be determined. We did that by defining the phase current and bus voltage. Max torque per voltage control strategy was used. In Figure 4, the speed vs torque characteristic can be seen.
.png)
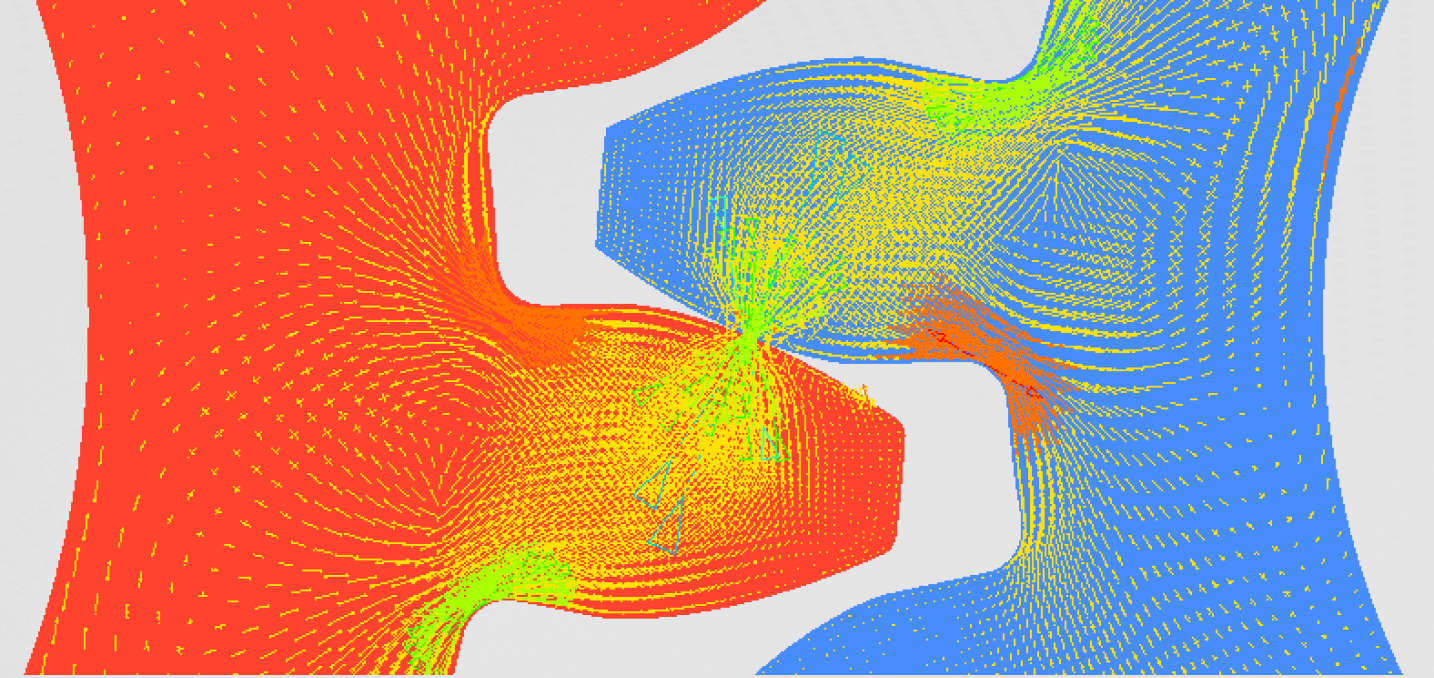
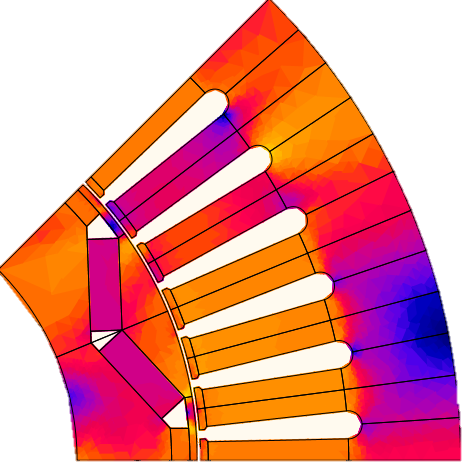
We can see that the corner point is at 400Nm and 1650 rpm. We use this point for the motor losses analysis. For a better understanding of the machine operation, the flux density graph was included.
.png)
Motor thermal losses:
- Winding losses: 6500 W
- Stator core losses: 125 W
- Rotor core losses: 95 W
- Magnet losses: 55W
These losses were later used in the thermal analysis.
Thermal analysis
The thermal behavior of the PMSM is rather complex since we have multiple fluid and solid domains. On the solid side, all the vital components were included. Since the motor is liquid-cooled, the cooling channel needs to be modeled and meshed appropriately. Perhaps the most challenging was the modeling of the air in the compound between the rotor and the stator. Since the air gap is very small (1mm) and the speed of the rotor is rather high, we are facing large velocity gradients. This can be a challenge to mesh and solve correctly. We can see the meshing of both the cooling channel and air compound, in the figure below.
.png)
.png)
Setting up the analysis, we had to prescribe all the thermal losses in the appropriate components, set the cooling channel inlet flow and the rotational velocity of the rotor. Postprocessing the results, we can see the velocities in both air compound and cooling channel.
.png)
.png)
In the figure below, we can observe how the temperature of the liquid is heating up towards the outlet.
.png)
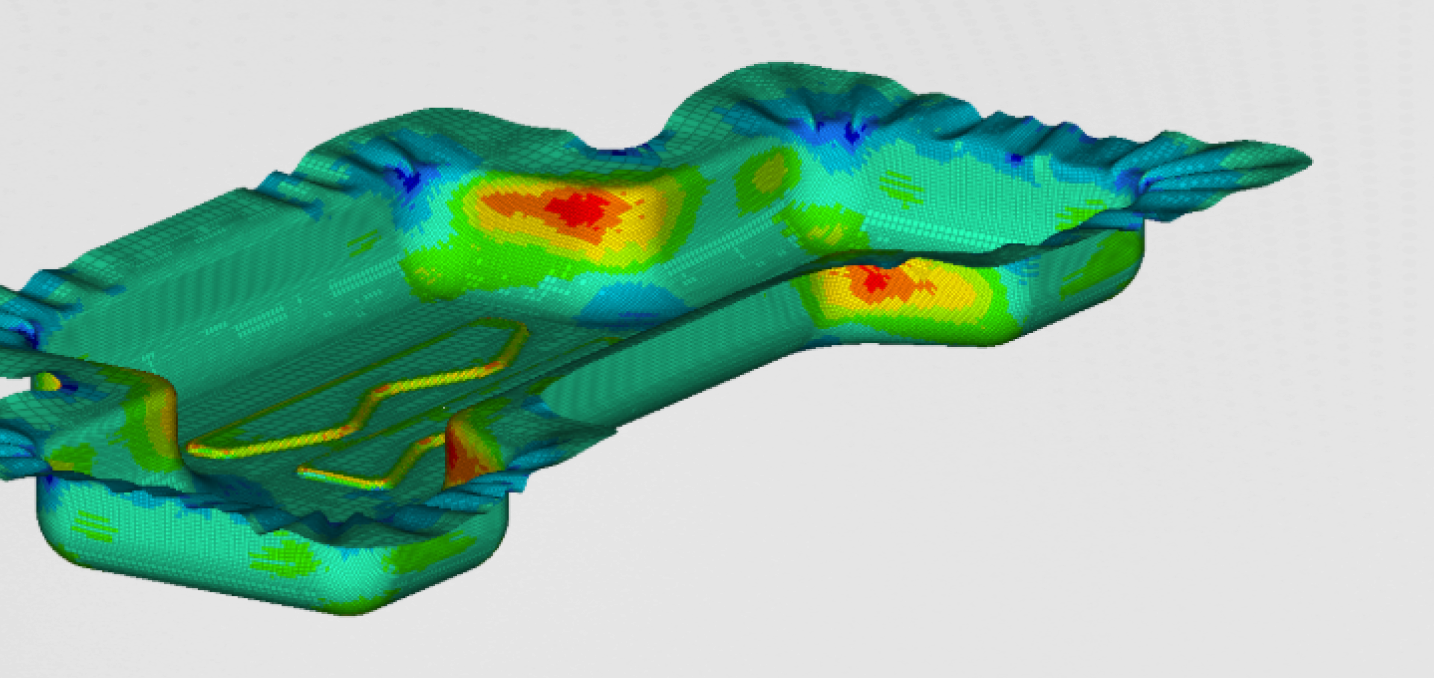
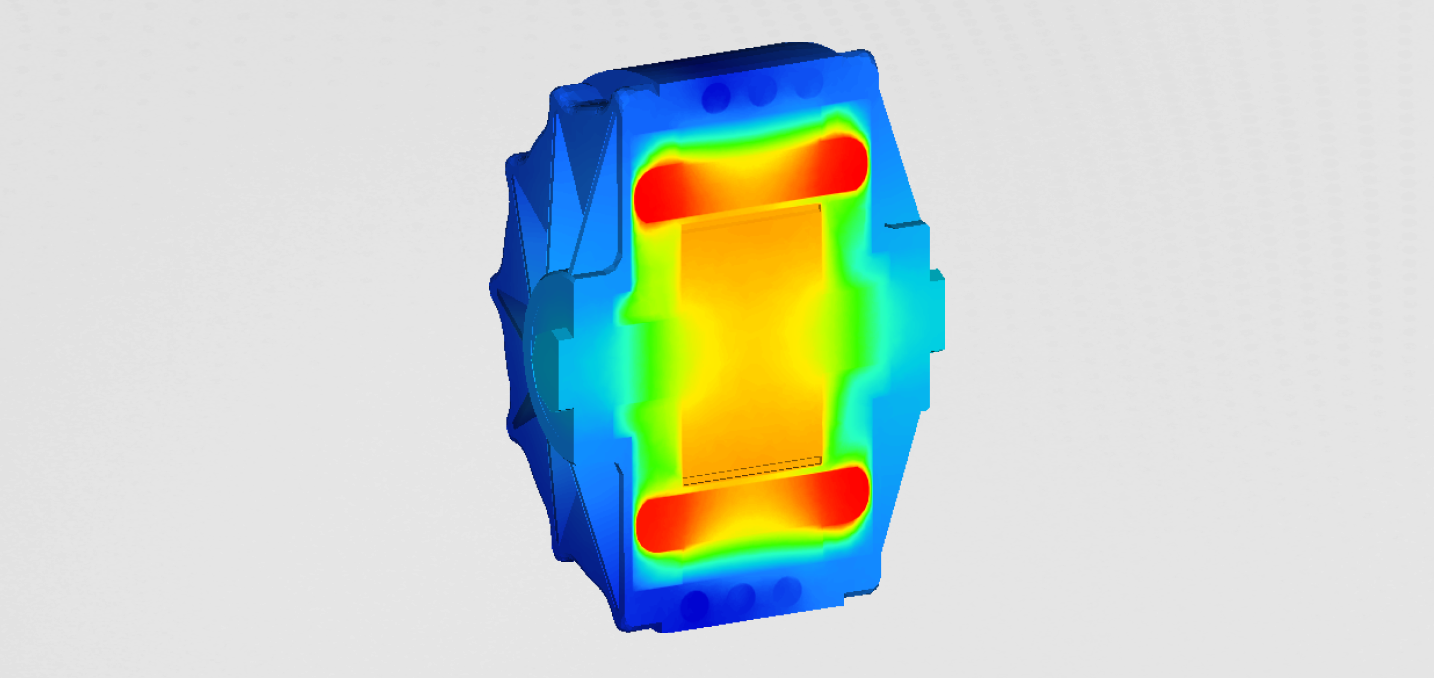
Finally observing the temperature field of the entire motor in cross-section, we can see that the peak temperature occurs on the end winding. This was expected since the majority of the thermal losses are generated in the winding. Looking further we can also see that the temperature on the rotor is rather high. Even though the rotor produces a relatively small amount of thermal losses. Of course, the temperature dissipation on the rotor is a lot lover, since the majority of the heat is dissipated through the airgap.
.png)
.png)