Introduction
Gearboxes are very complex structures with many moving components. In this case study, an example of how to study the NVH of the gearbox is presented. The main source of vibrations is coming from the imbalance of gears and shafts.
Simulation methodology
For this case study, the model of the gearbox was relatively simple. Gearbox casing was the only part modeled in detail. Shafts and gears were simplified with a 1D finite element. All the parts of the gearbox casing were connected with bolted connections. The gearbox was constrained at the front and the back of the casing. The loading for static analysis mimicked severe vertical acceleration during a rough ride. Following the static analysis, the NVH of the gearbox was simulated. The NVH analysis was performed in the following steps:
- Modal analysis for the gearbox assembly
- Frequency response of the gearbox under the imbalance loads
- Noise and Effective radiated power analysis
Geometry and mesh
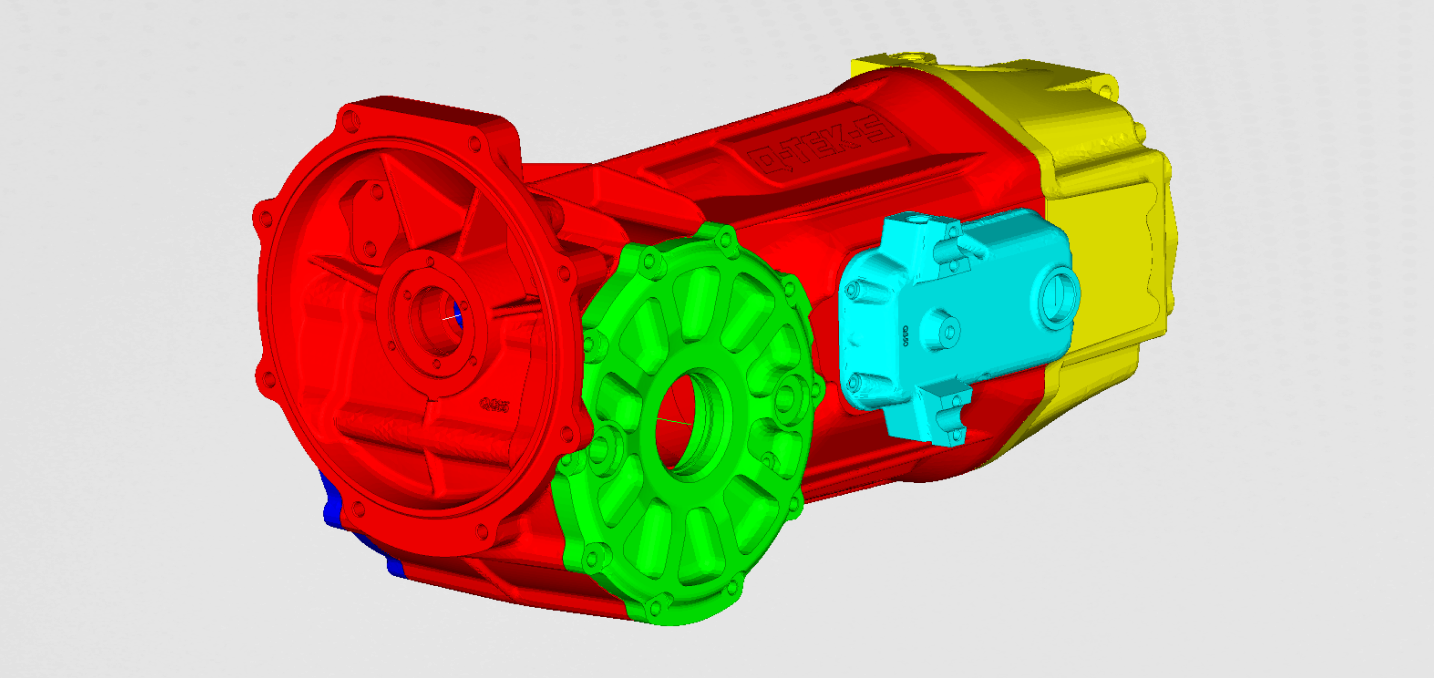
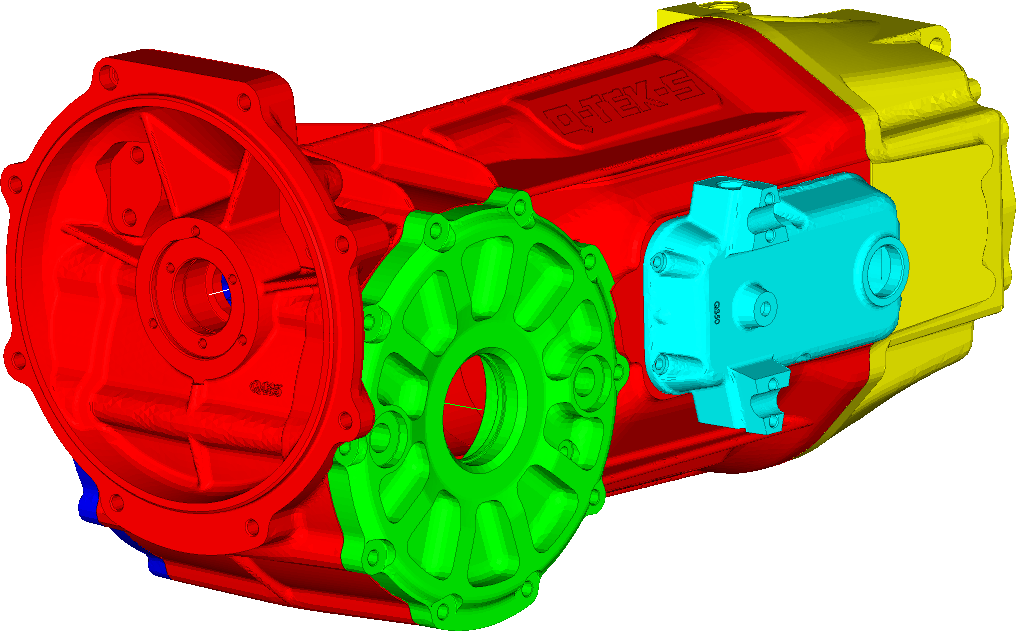
The casing of the Gearbox was stripped down to 7 parts. Each one of them meshed with solid finite elements. The bearing was simplified with the 1d elements. These bearing elements connected the shafts to the casing of the gearbox. To be able to extract the sound pressure, a sphere was modeled on the 1m radius. The finite element model is presented in Figure 1.
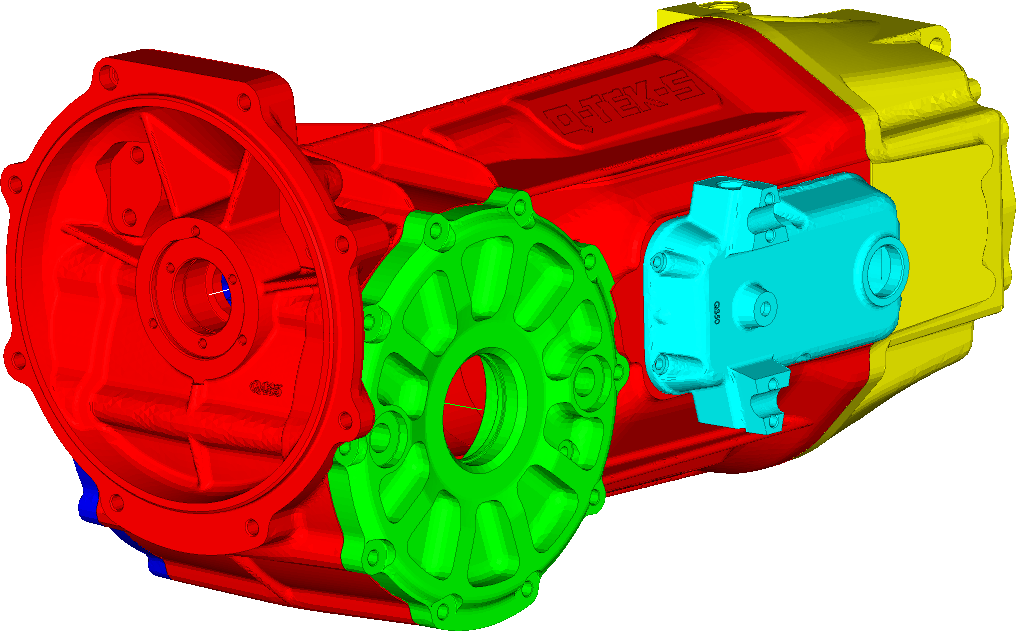
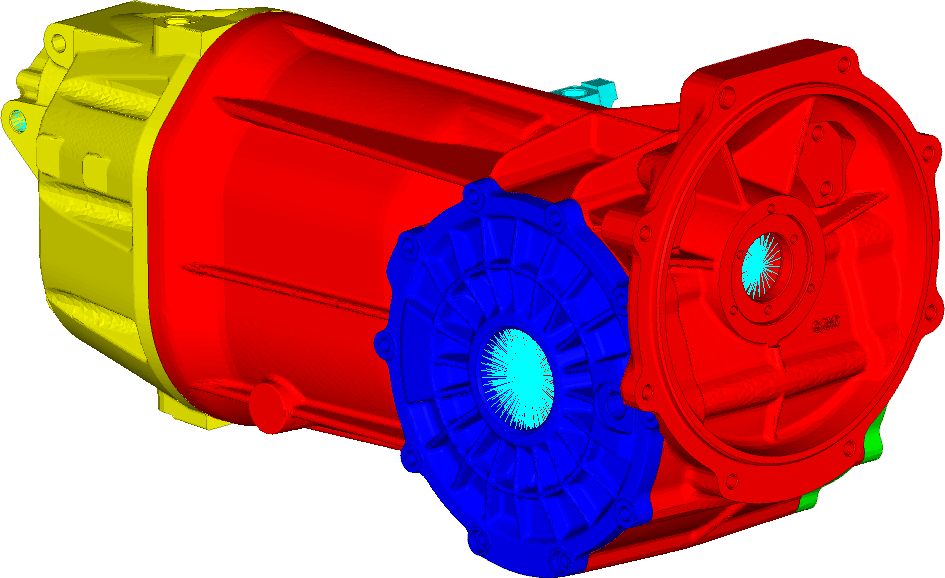
It can be seen in Figures 1 and 2 how the 1D elements representing the bearing, were assigned. We can also see where the shafts were placed.
Loads and Boundary conditions
Boundary conditions were the same for both the statics and NVH analysis.
STATIC ANALYSIS
Boundary conditions were assigned at the front and the rear side of the gearbox. The loading for the static analysis came in the form of the vertical acceleration. The acceleration was set to 15g.
NVH
For the modal analysis, the boundary conditions were the same as for the static analysis. In the frequency response step, the force representing the imbalance of the shafts and the gears were included.
Results
STATIC ANALYSIS
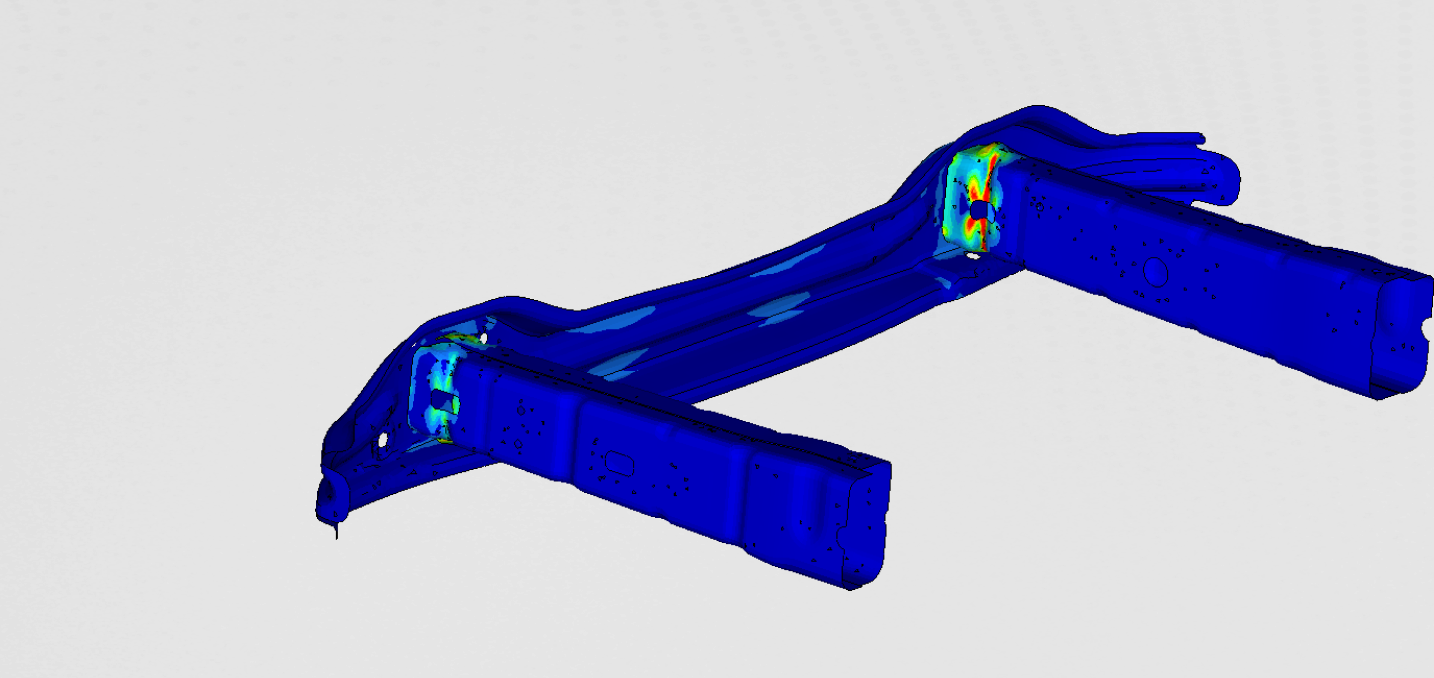
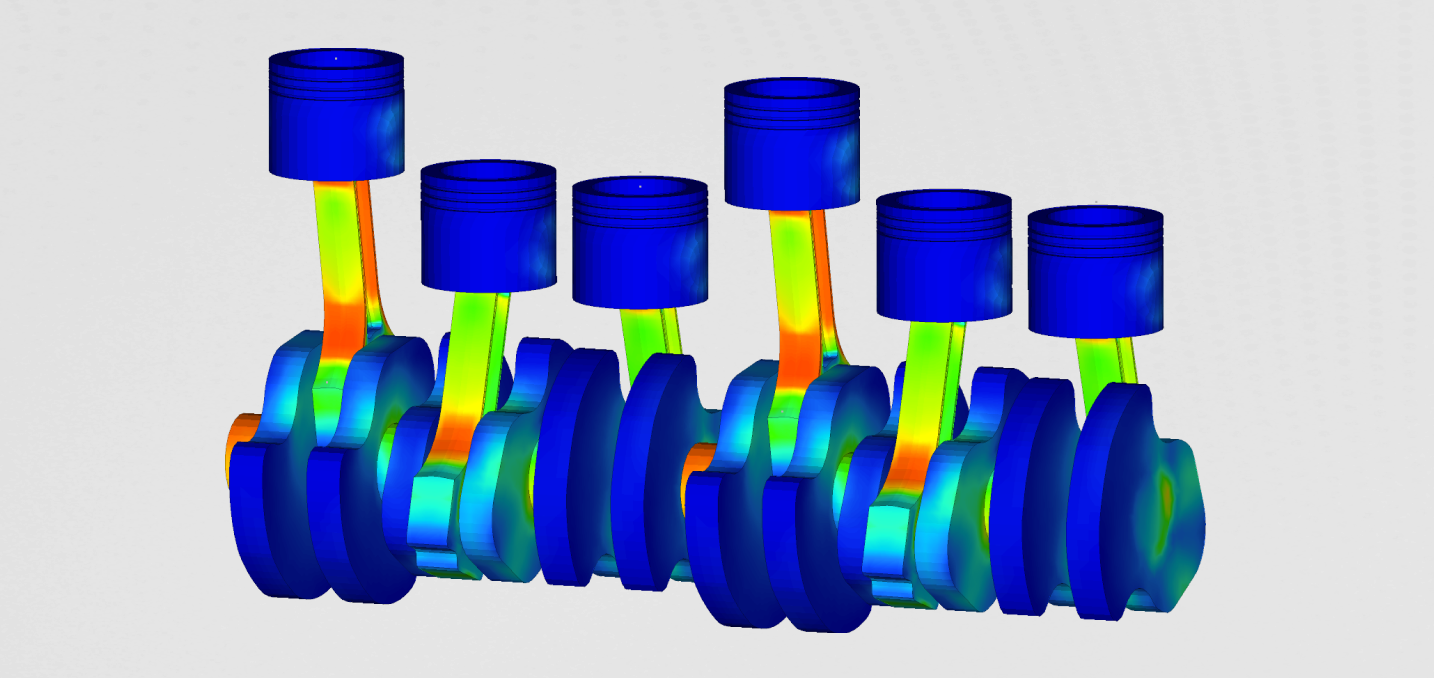
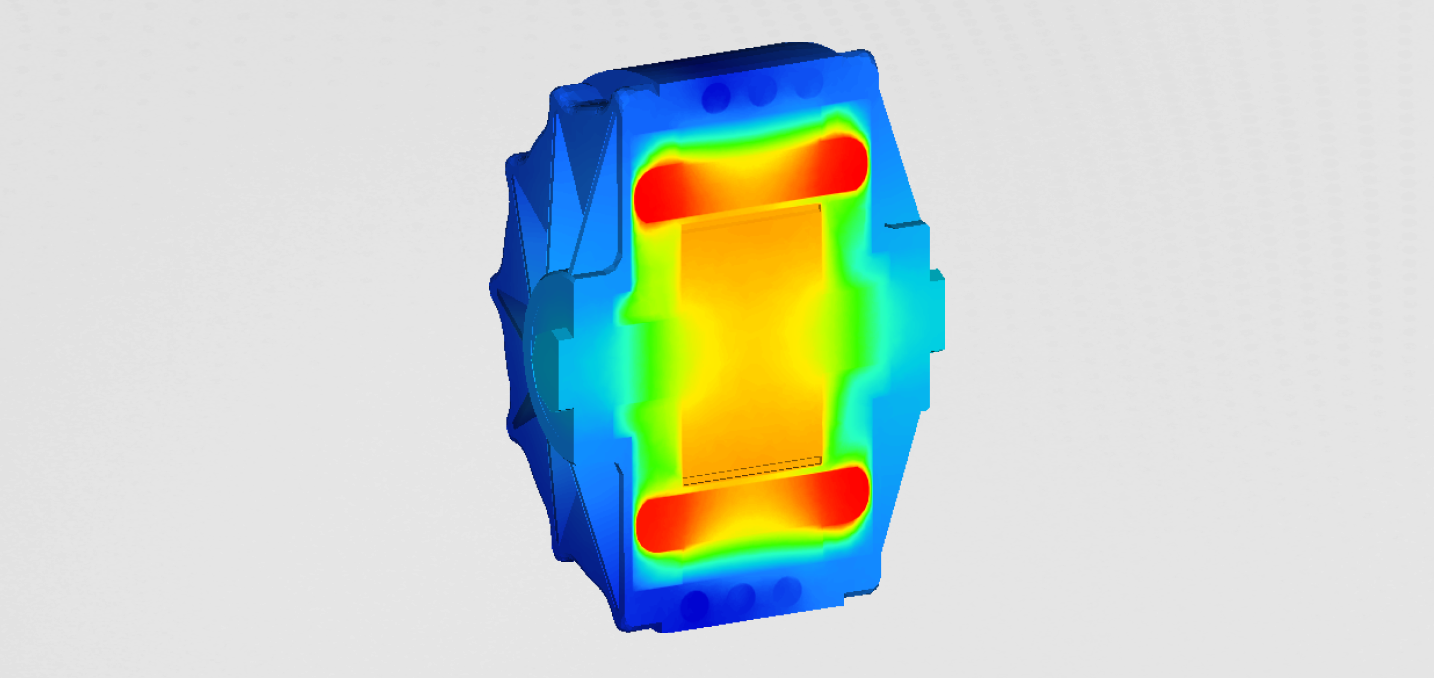
Stresses and displacement were the most important results obtained with static analysis. Both can be found in the figure below.
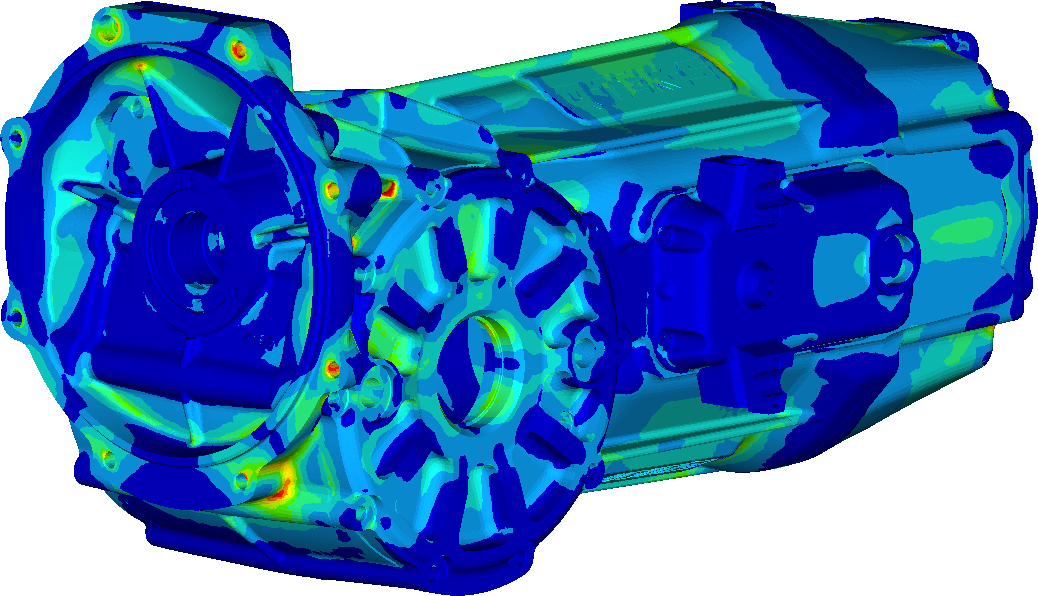
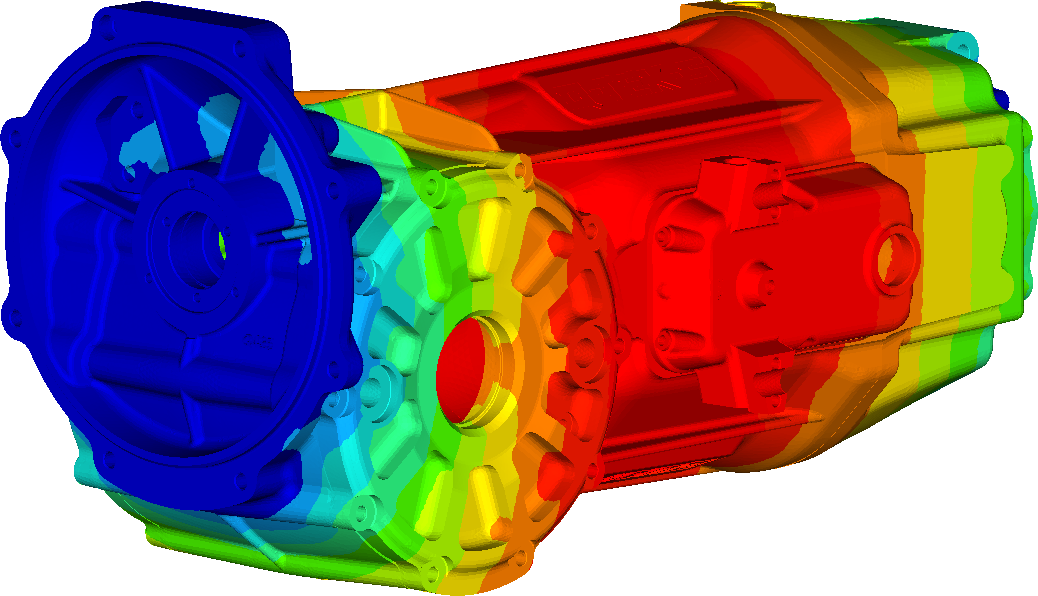
It can be seen that the stresses in the material don't exceed 200MPa. In our case that is below the yield criterion of the materisl. The stresses are the largest at the places near the bolts. The stress peak can also be seen at the radius of some reinforcing ribs. The deformations are the largest in the middle of the gearbox.
MODAL ANALYSIS
In the modal analysis, we were mainly interested in the natural frequencies and mode shapes.
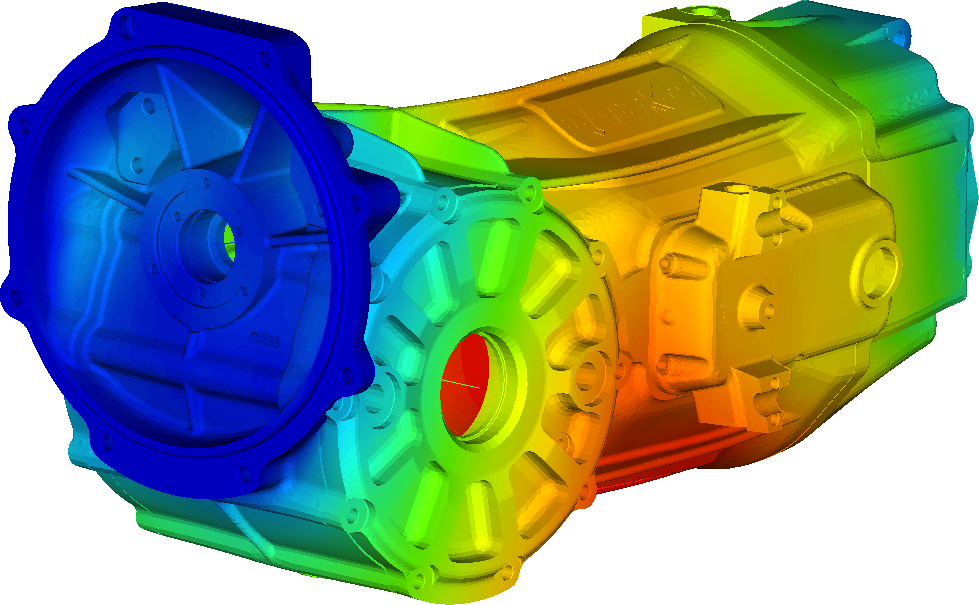
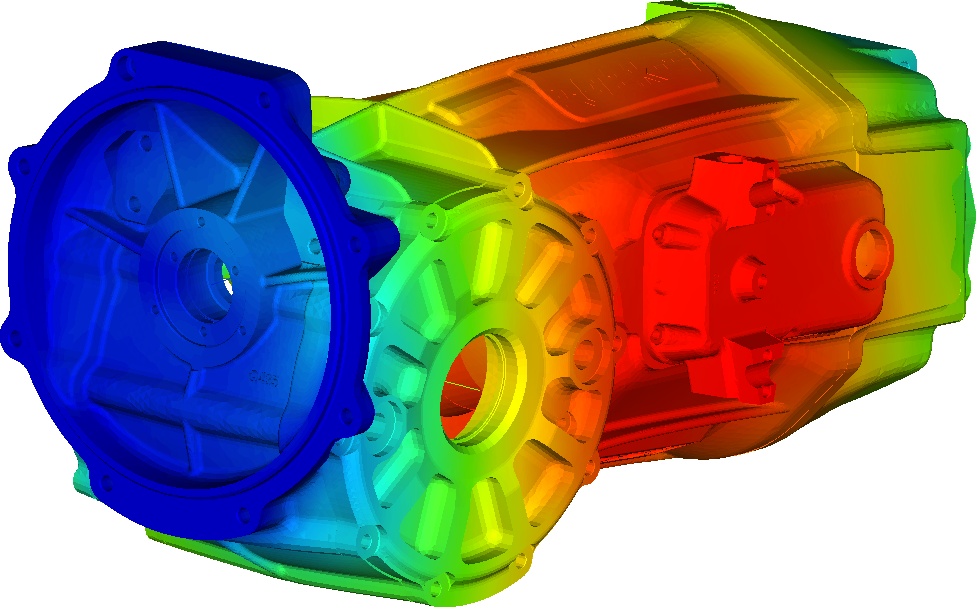
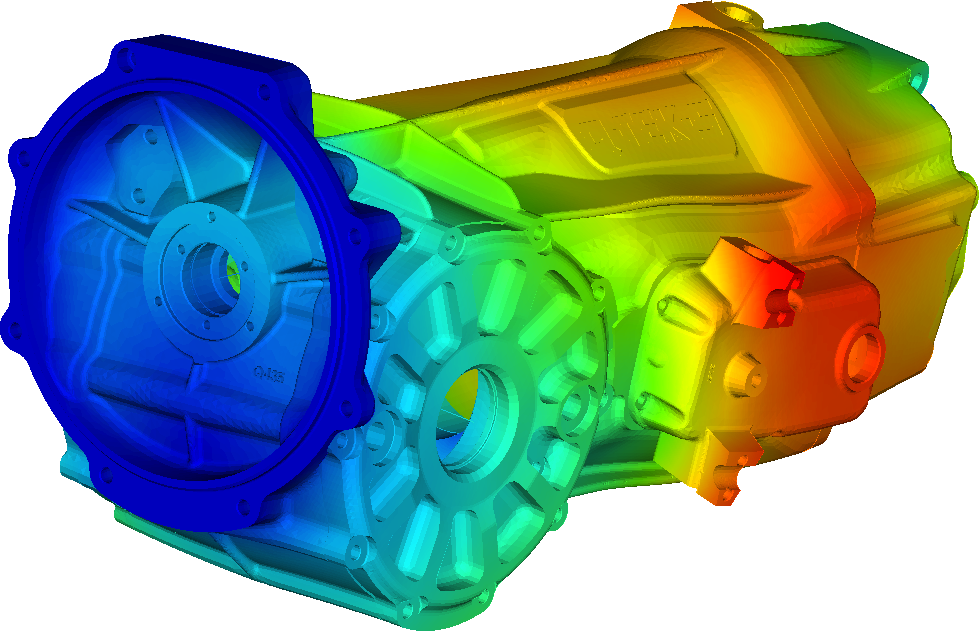
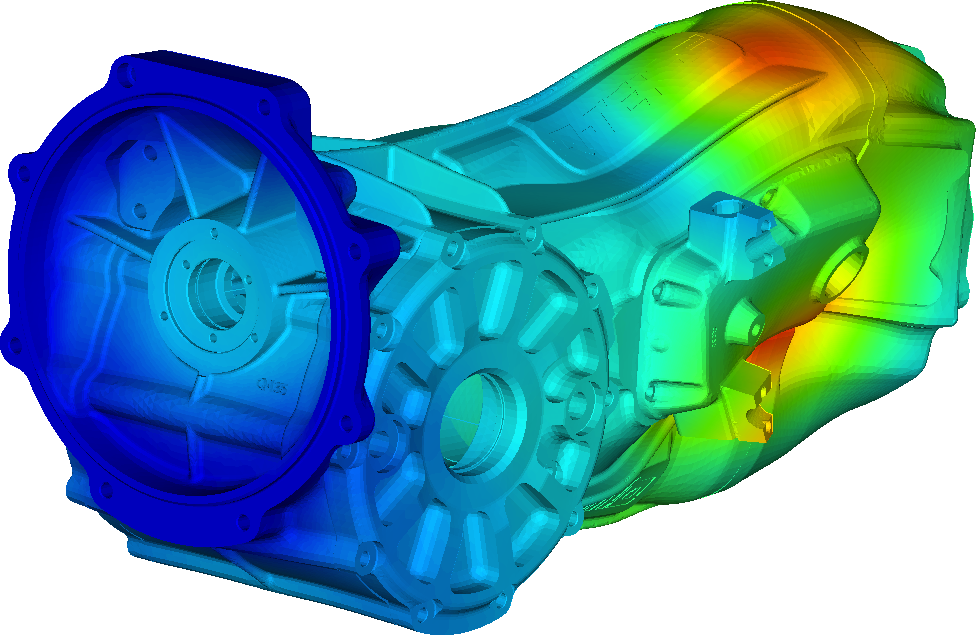
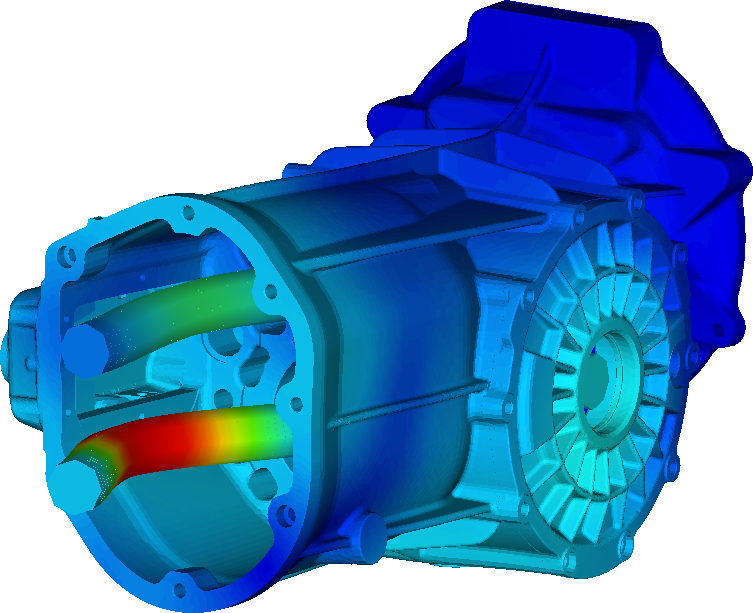
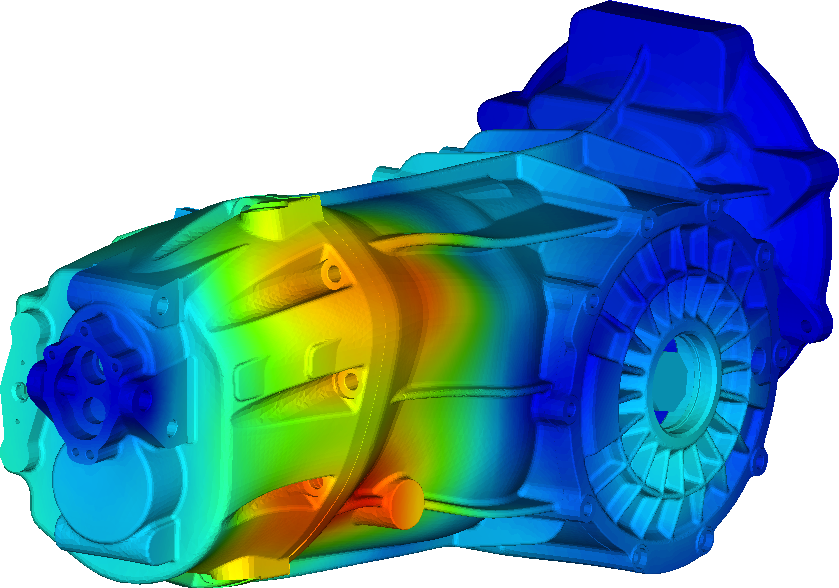
These mode shapes were the basses for the later frequency response and the acoustic analysis.
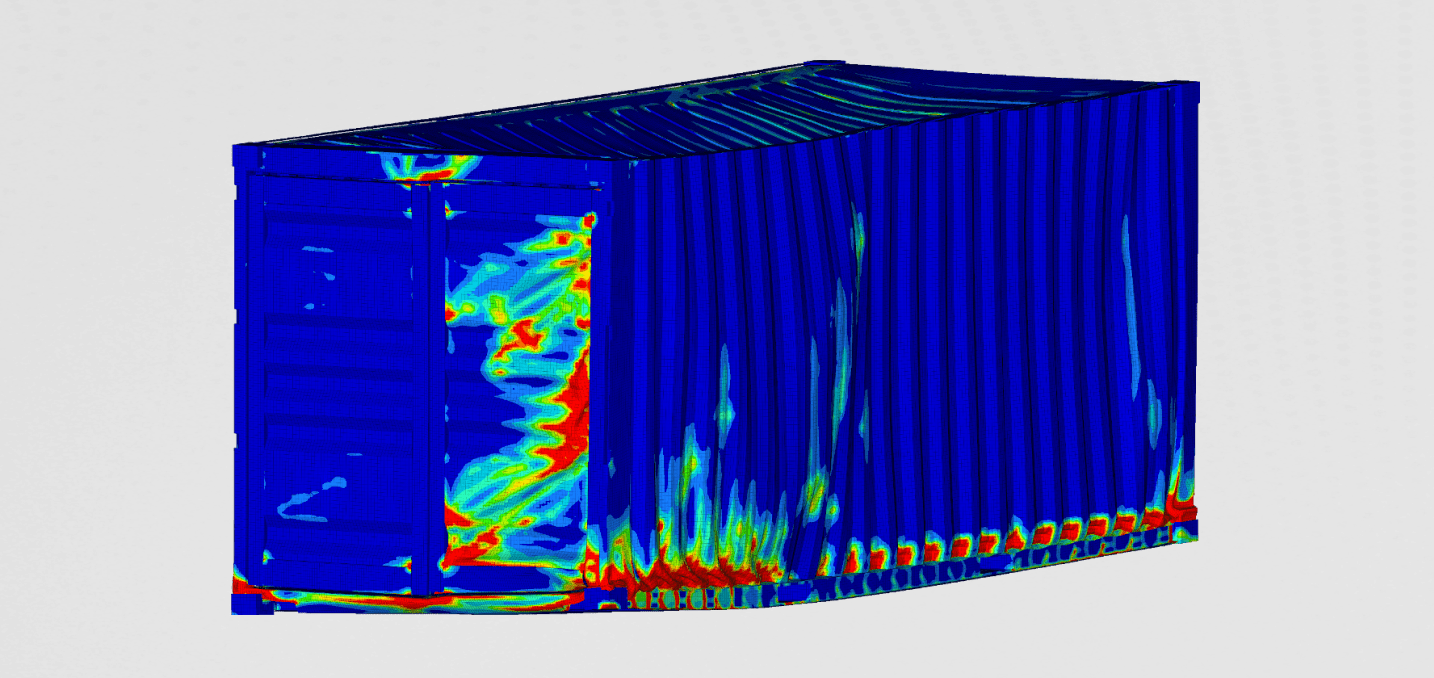
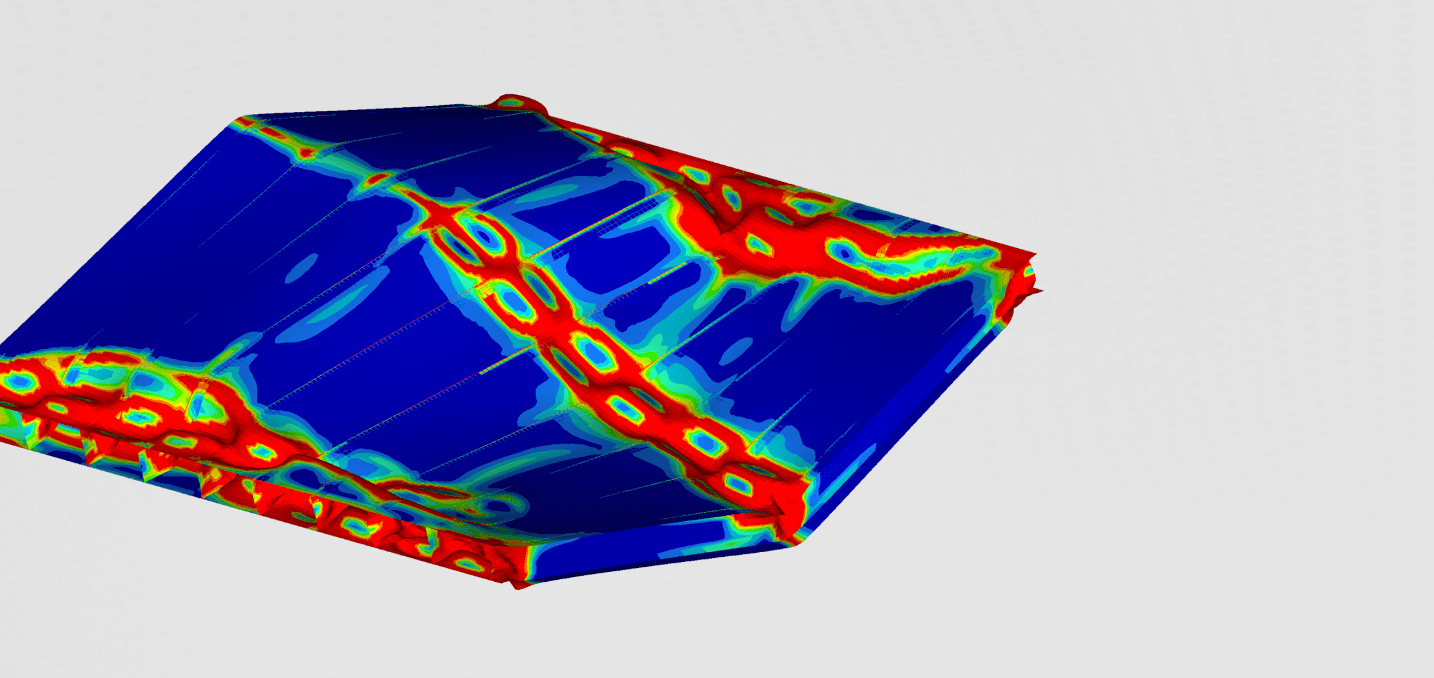
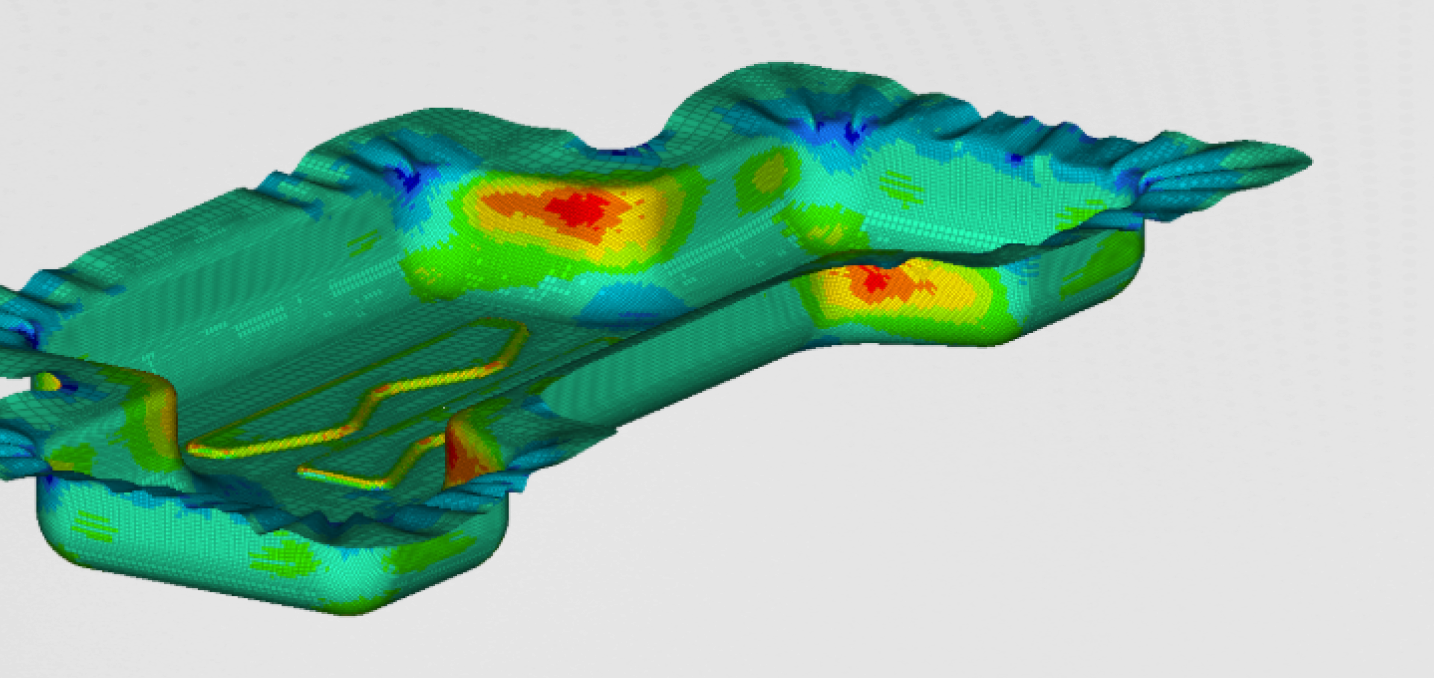
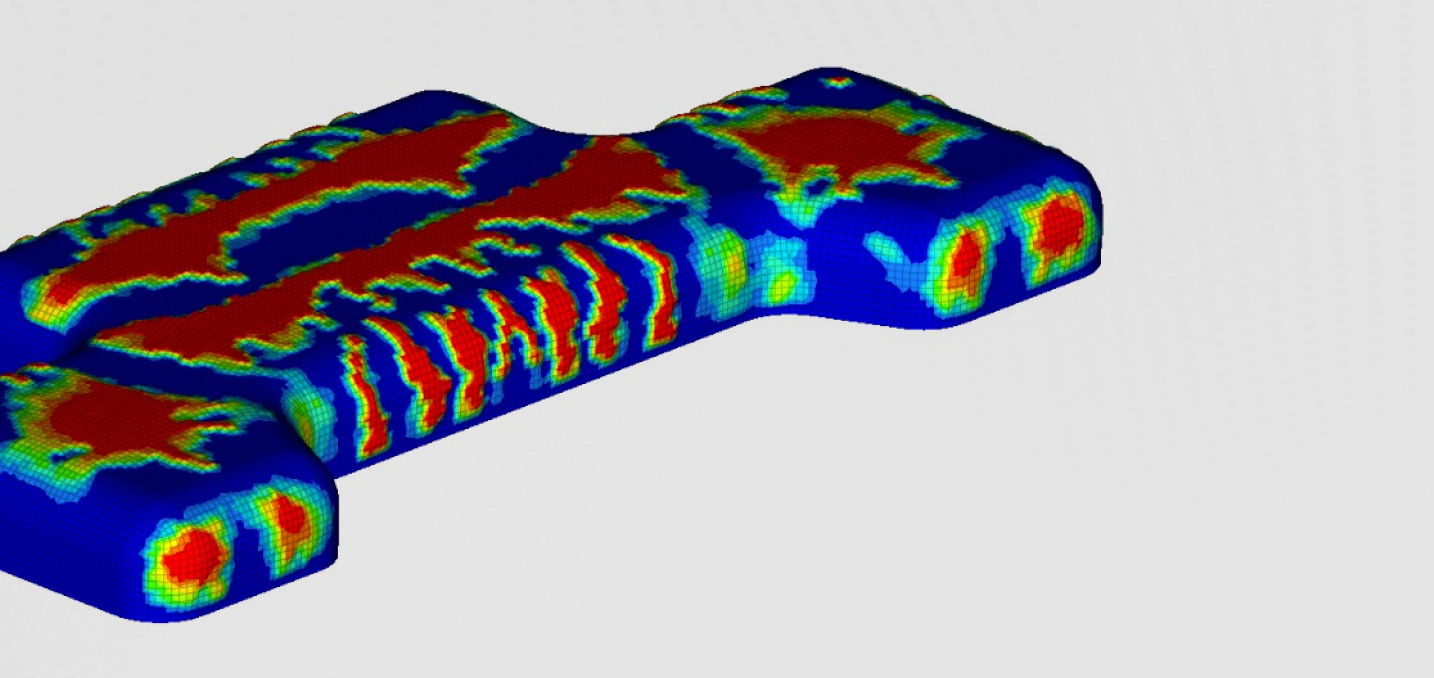
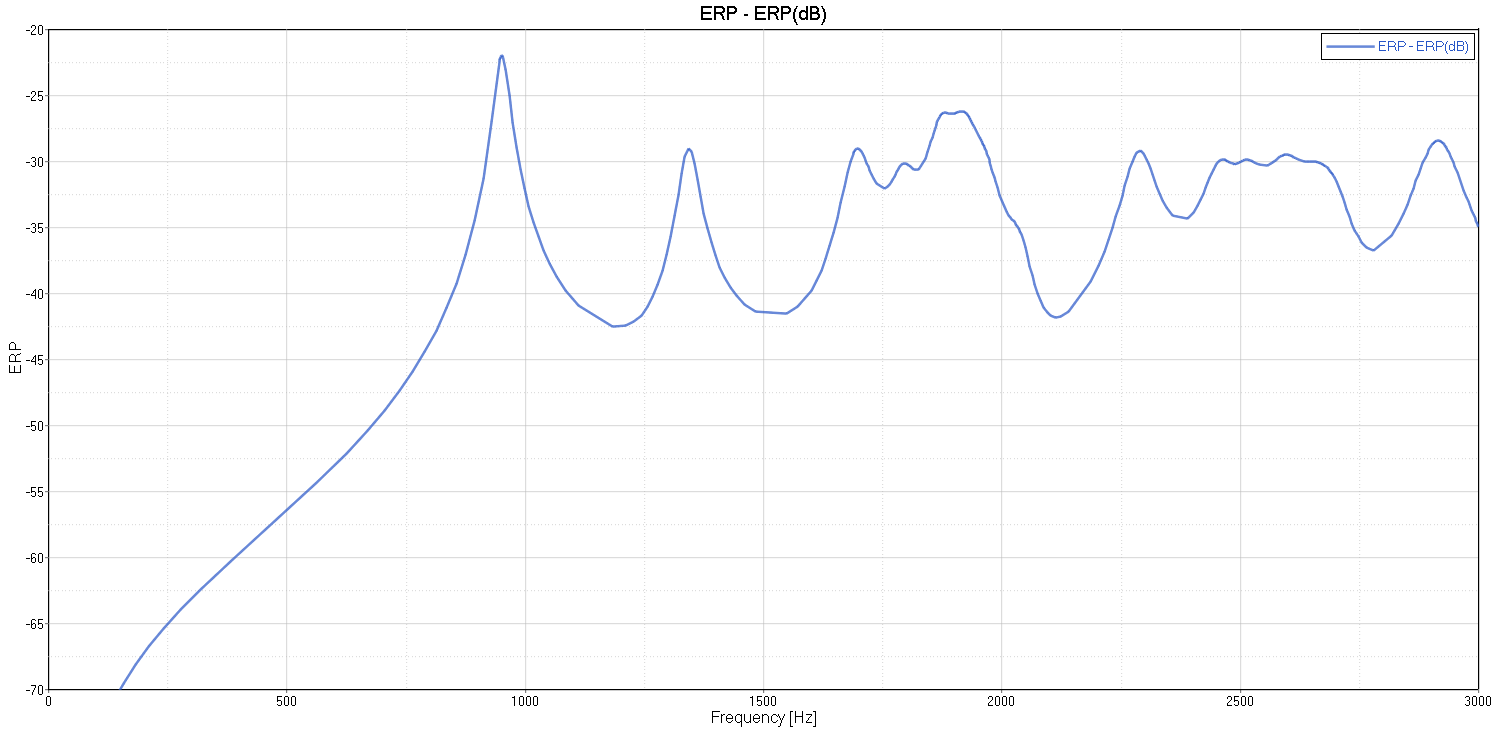
EFFECTIVE RADIATED POWER
The calculation of effective radiated power is a fast and very efficient indication of NVH performance. For the structures where the main source of radiation comes from the vibration, the ERP and sound power are quite similar.
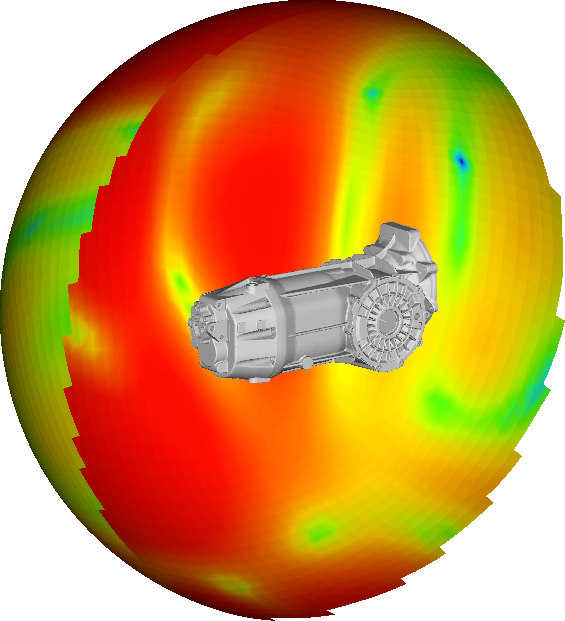
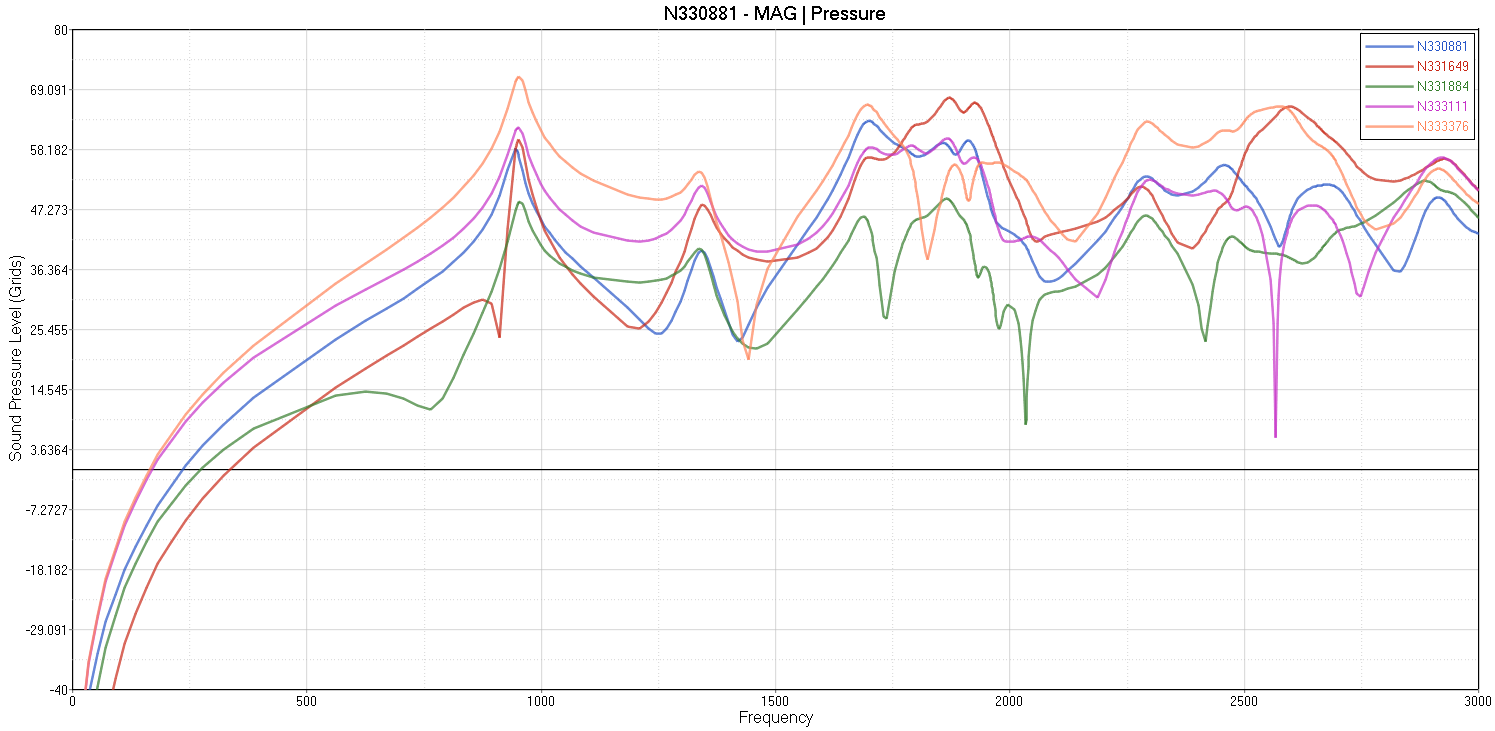
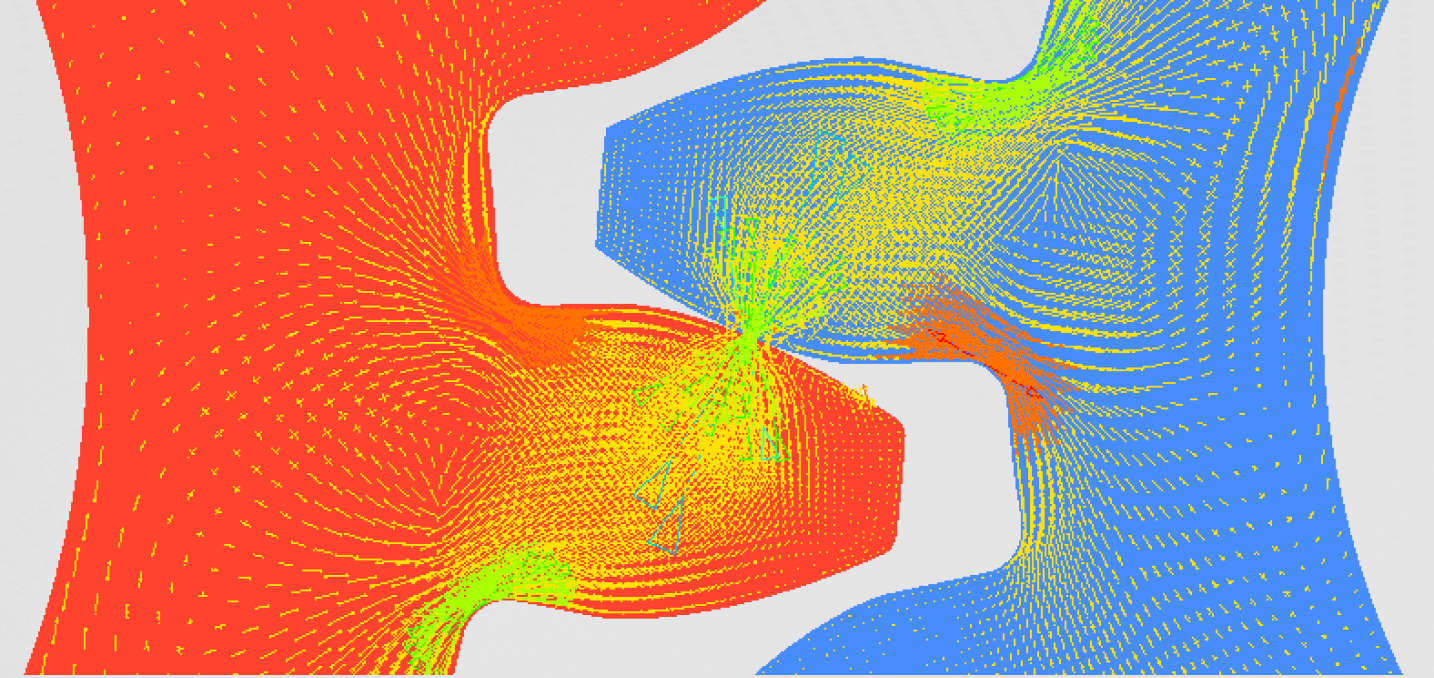
SOUND PRESSURE
Finlay the sound pressure was evaluated on the sphere 1.5 m for the center of the gearbox. This gives us a good insight into the distribution of the noise in the surrounding air.