Introduction
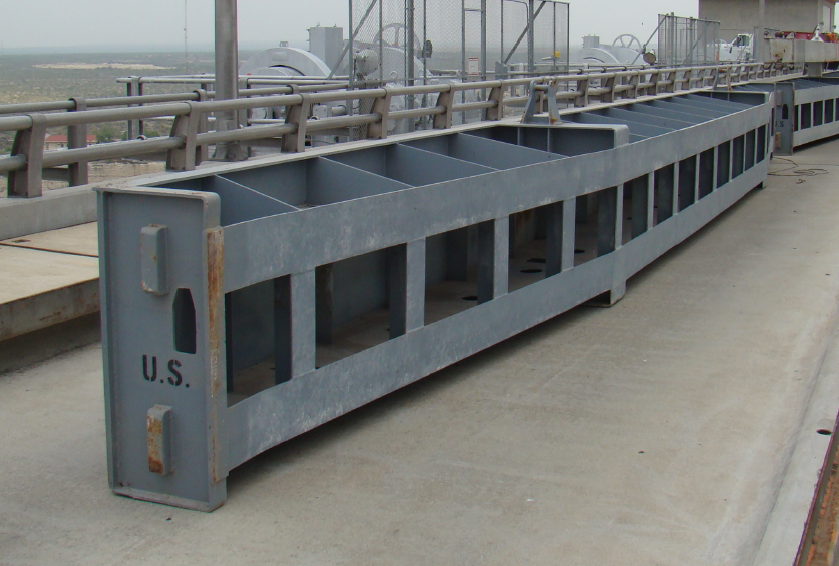
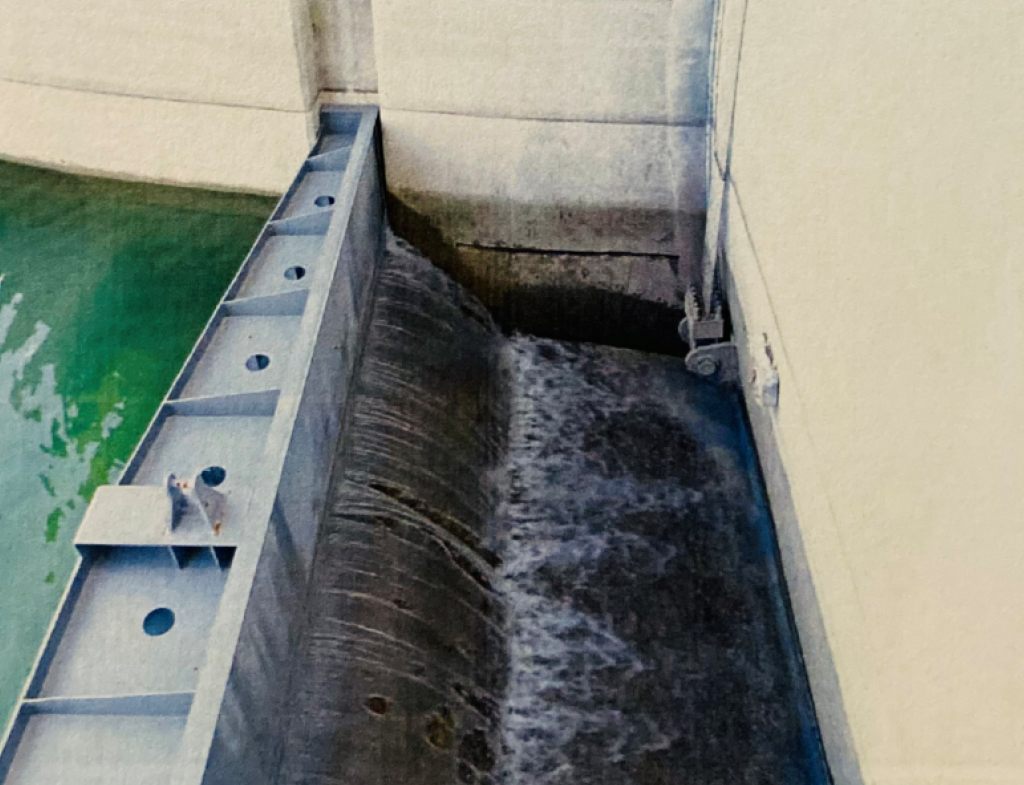
When the U.S. Department of Energy reached out to us, they needed a structural integrity assessment of their stop log systems. These massive steel barriers serve as temporary dams, holding back water pressure while equipment downstream gets maintenance. A structural failure could damage critical infrastructure and endanger personnel working behind the logs.
Stop logs must comply with Bureau of Reclamation Design Standards No. 6 and AISC specifications. The fundamental challenge is holding back full water pressure with one side completely dry. The main goal during this initial phase was to determine the failure loading of the stop log with possible improvements for higher load capacity.
Loading and Failure Modes
The hydrostatic pressure builds with depth following the equation p(h) = γw · h. Additional loads include the structure's dead weight, installation dynamics, potential ice loading, and seismic forces.
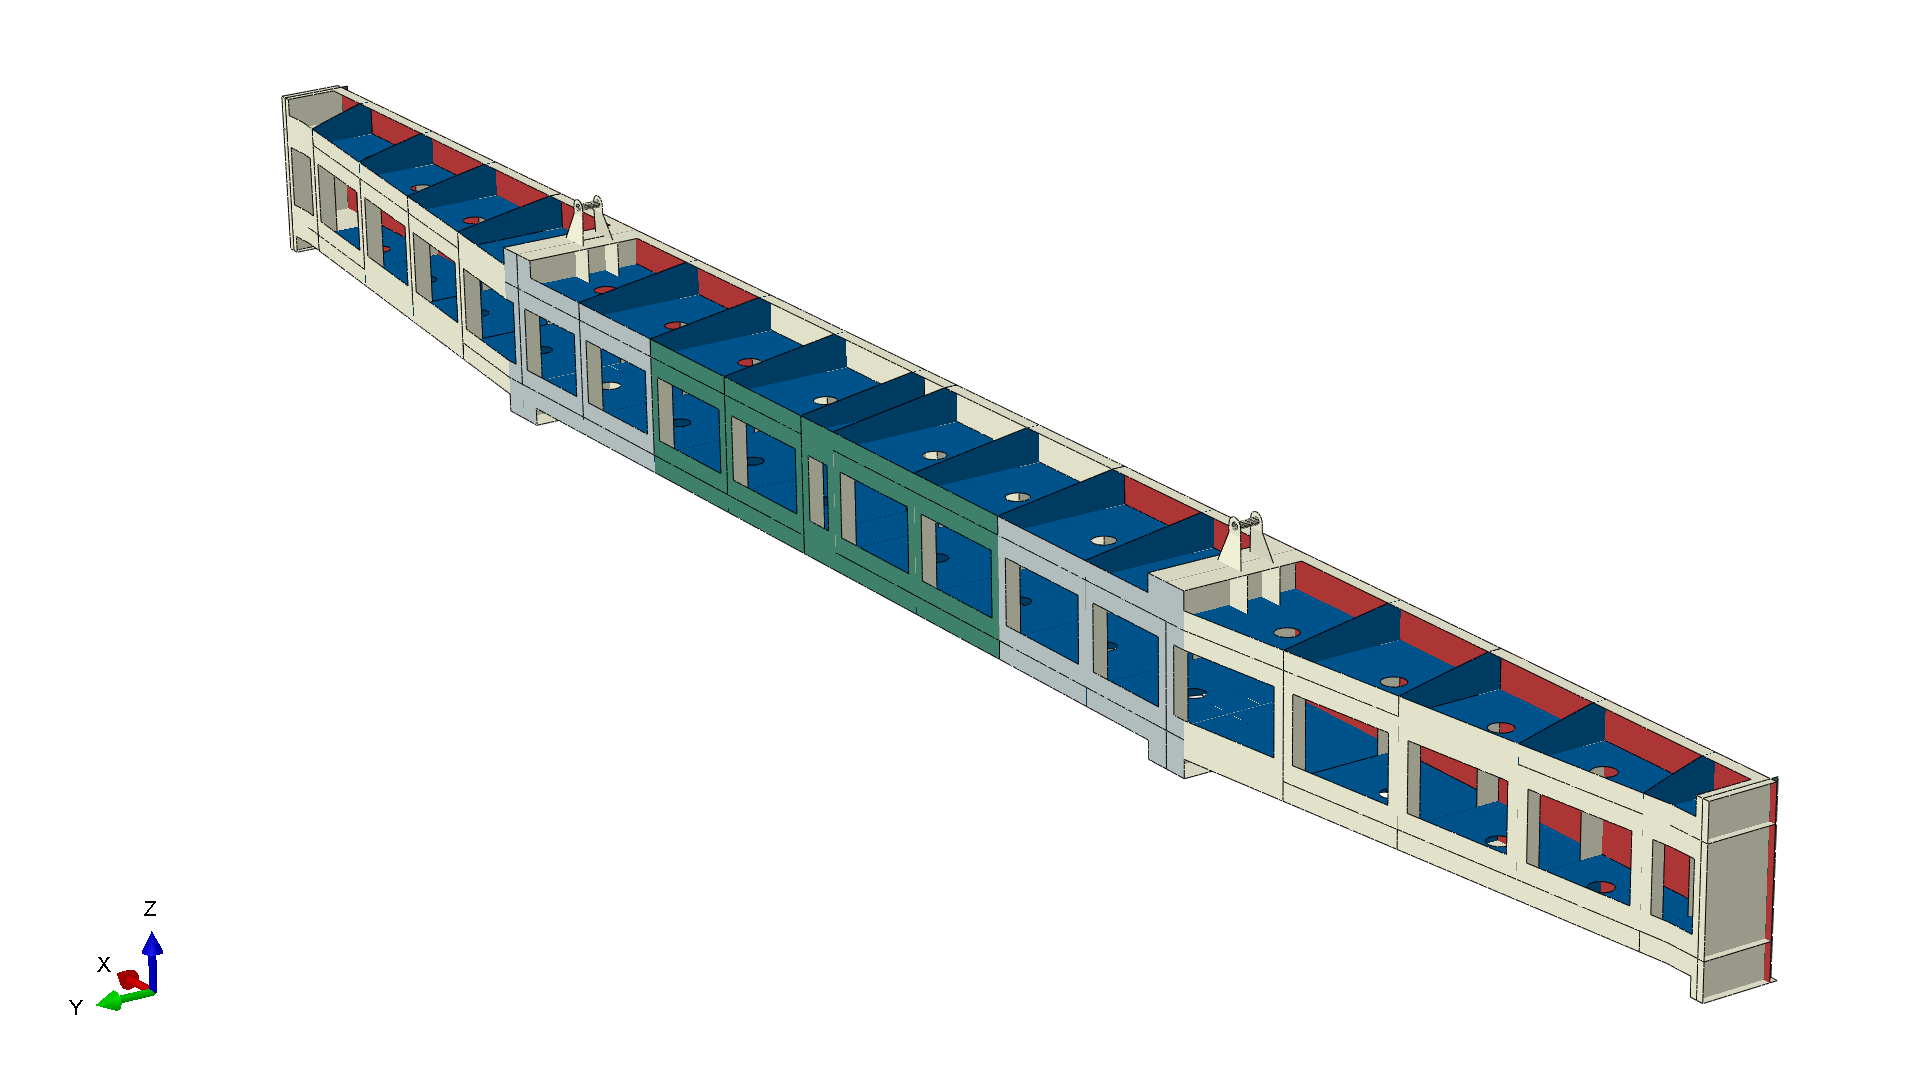
The cellular design creates several potential failure modes. Local buckling poses the greatest threat, particularly in compression flanges of horizontal support beams where thin steel plates can suddenly buckle outward like stepping on an aluminum can. Web plates face combined bending and shear stresses, while skin plates must resist direct water pressure.
Global buckling could cause the entire structure to bow or twist, especially critical for taller configurations. Material yielding occurs when stresses exceed the steel's yield strength, typically in maximum moment regions, connection details, and bearing points. Connection failures deserve special attention as they can trigger progressive collapse. After reviewing the loading patterns and structural layout, local buckling of compression elements would likely govern the design.
Choosing the Right Analysis Approach
For this analysis, we turned to Abaqus/Standard, a proven workhorse in the structural analysis world. The key decision was implementing a geometrically nonlinear analysis approach. Why nonlinear? Because buckling isn't a linear phenomenon - when thin plates start to buckle, they don't follow the neat, predictable paths that linear analysis assumes. We needed to capture the real behavior as the structure deforms and potentially buckles under load.
The analysis setup incorporated large deformation theory to track how the geometry changes as loads increase. We also included elastic-plastic material behavior with strain hardening, meaning the steel could yield and continue to carry load beyond its initial yield point. Contact interactions with the concrete support structures were essential to simulate realistic boundary conditions. Finally, we built in imperfection sensitivity analysis capabilities, because real structures always have small imperfections that can trigger buckling at lower loads than perfect theoretical models would predict.
Material Properties and Behavior
The stop log was constructed from AISI 316L stainless steel, a material chosen for its corrosion resistance in the harsh water environment. Getting the material properties right was crucial for accurate results.

Rather than using a simple elastic-perfectly-plastic model, we implemented a multilinear stress-strain relationship based on actual material test data. This approach captures the gradual transition from elastic to plastic behavior and the strain hardening that occurs as the material continues to deform beyond yielding. This level of detail becomes critical when analyzing post-buckling behavior, where the structure continues to carry load even after local buckling has occurred.
Meshing Strategy and Element Selection
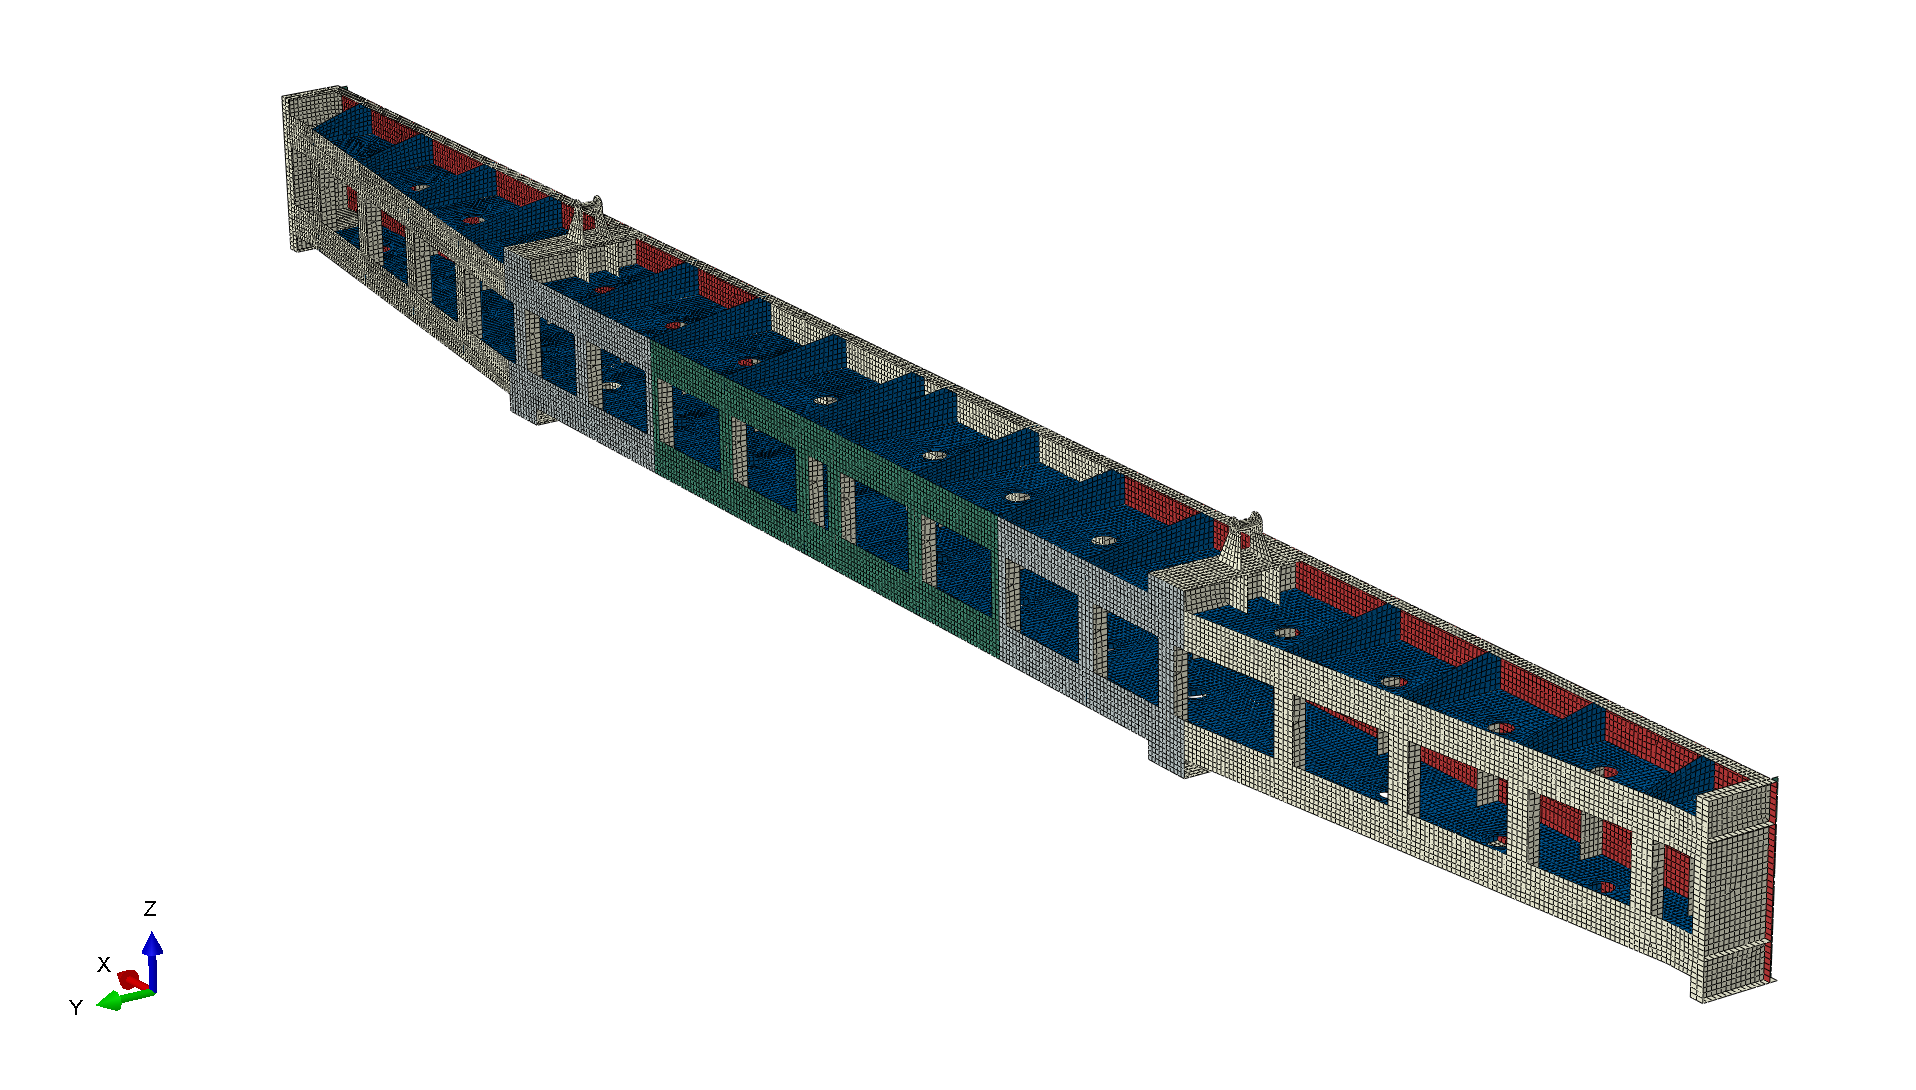
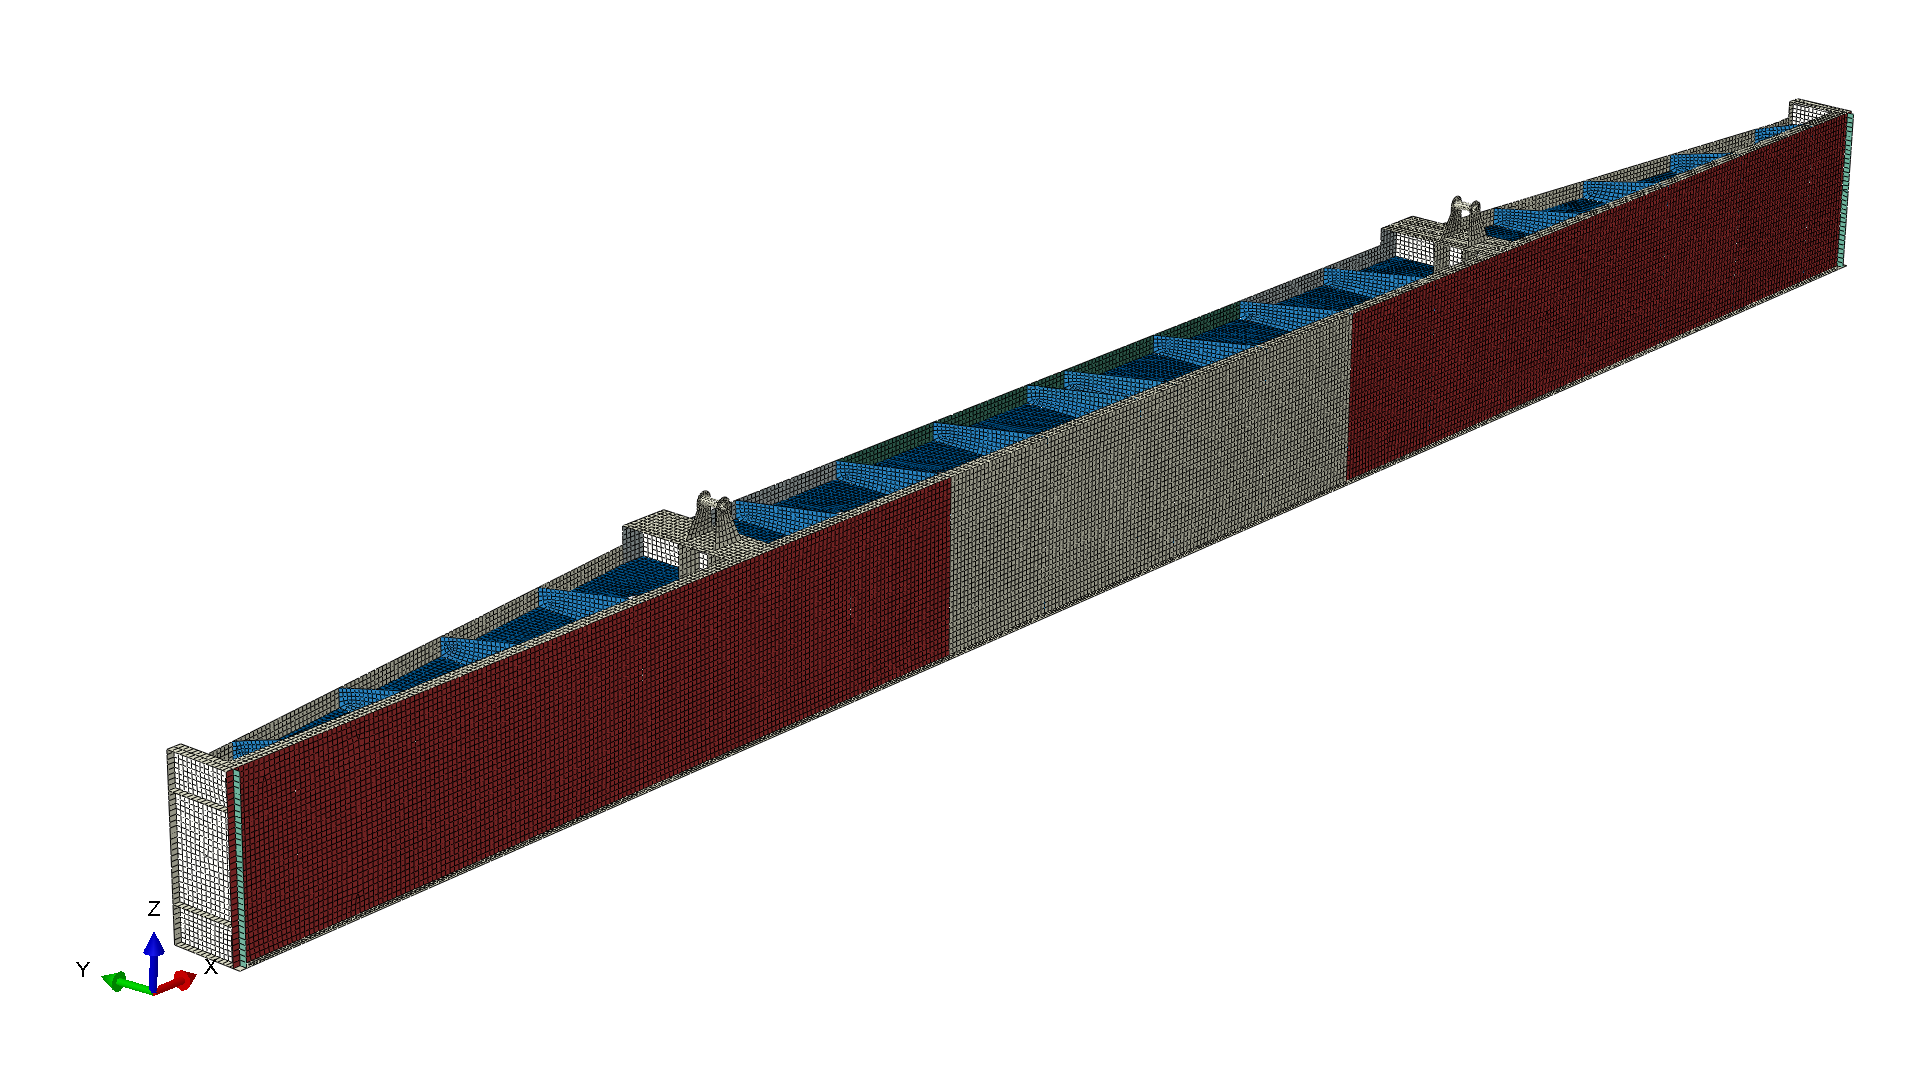
The meshing approach required careful consideration of both accuracy and computational efficiency. We selected shell elements (S4R) throughout the model, a choice that makes perfect sense for this thin-walled structure. Shell elements capture the bending and membrane behavior that dominates in thin plates and beams while avoiding the computational expense of solid elements.
The mesh itself used a structured approach with quadrilateral elements across all surfaces. This structured meshing provides several advantages: better element quality, more predictable convergence behavior, and easier interpretation of results. We refined the mesh density in areas where we expected high stress gradients, particularly around connection details and support locations. Element sizing was optimized through convergence studies, where we systematically refined the mesh until the results stabilized. The final model contained approximately 245,000 elements, striking a balance between accuracy and reasonable computation time.
Boundary Conditions and Load Application
Setting up realistic boundary conditions proved crucial for obtaining meaningful results. The actual stop log sits in concrete guides that provide both vertical support and lateral restraint while allowing the structure to slide during installation and removal.
We modeled this using contact surfaces between the stop log end plates and the concrete guides. Since the stiffness of the concrete in this case is a lot larger compared to the stop log, the concrete guides were modeled as rigid surface. A friction coefficient of 0.3 was applied at these contact interfaces, representing typical steel-on-concrete friction. The vertical support came from the bottom guide seats, while lateral restraint simulated the guide slot constraints that prevent the stop log from moving horizontally while still allowing the controlled vertical movement during installation.
 Contact boundary condition between the stop log and concrete
 The loading was applied gradually in increments, allowing us to track the structure's response as stresses built up. This incremental approach also enabled us to identify the precise point where buckling initiated and to follow the post-buckling behavior that determines the ultimate load capacity.
Results and Discussion
We were mainly interested in two points along the loading. The first one was the max load capacity point, which occur just before the buckling. Images indicate the regions of high stress that will later lead to the local buckling in that region.
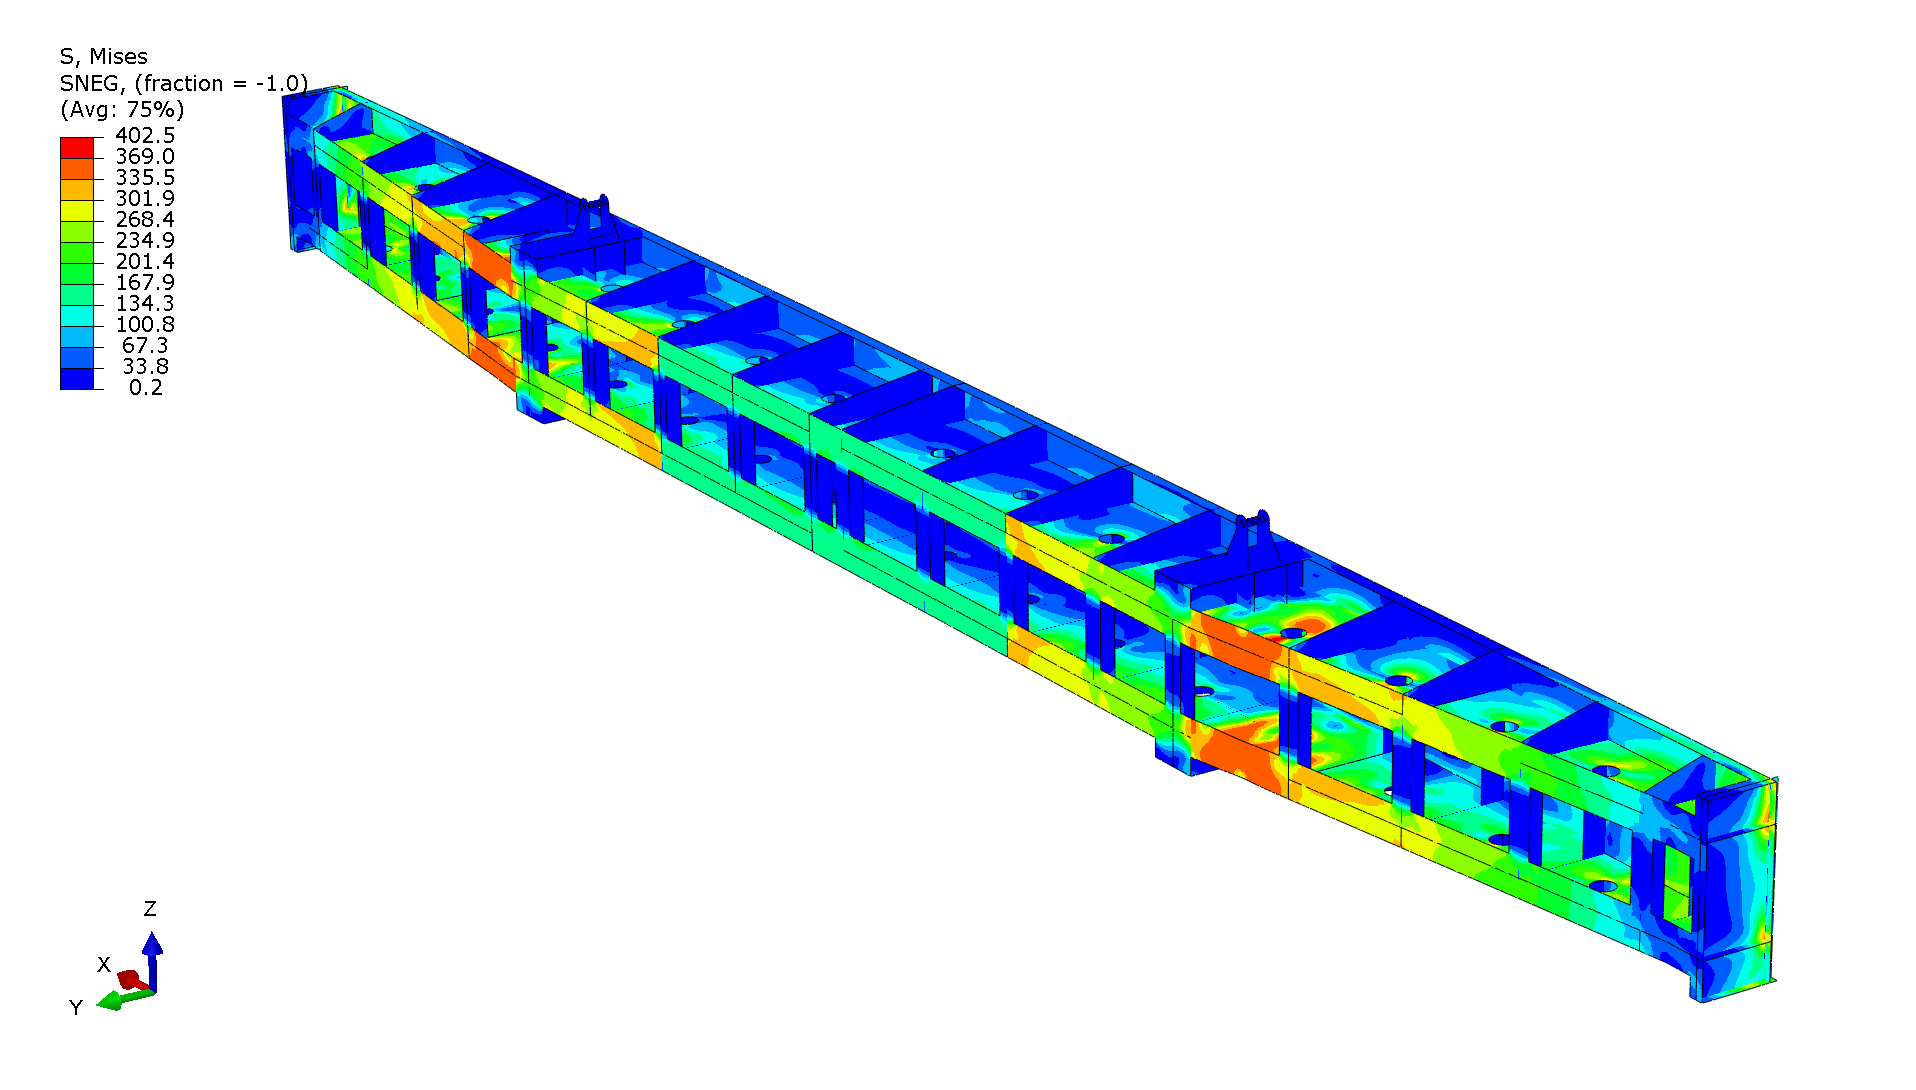
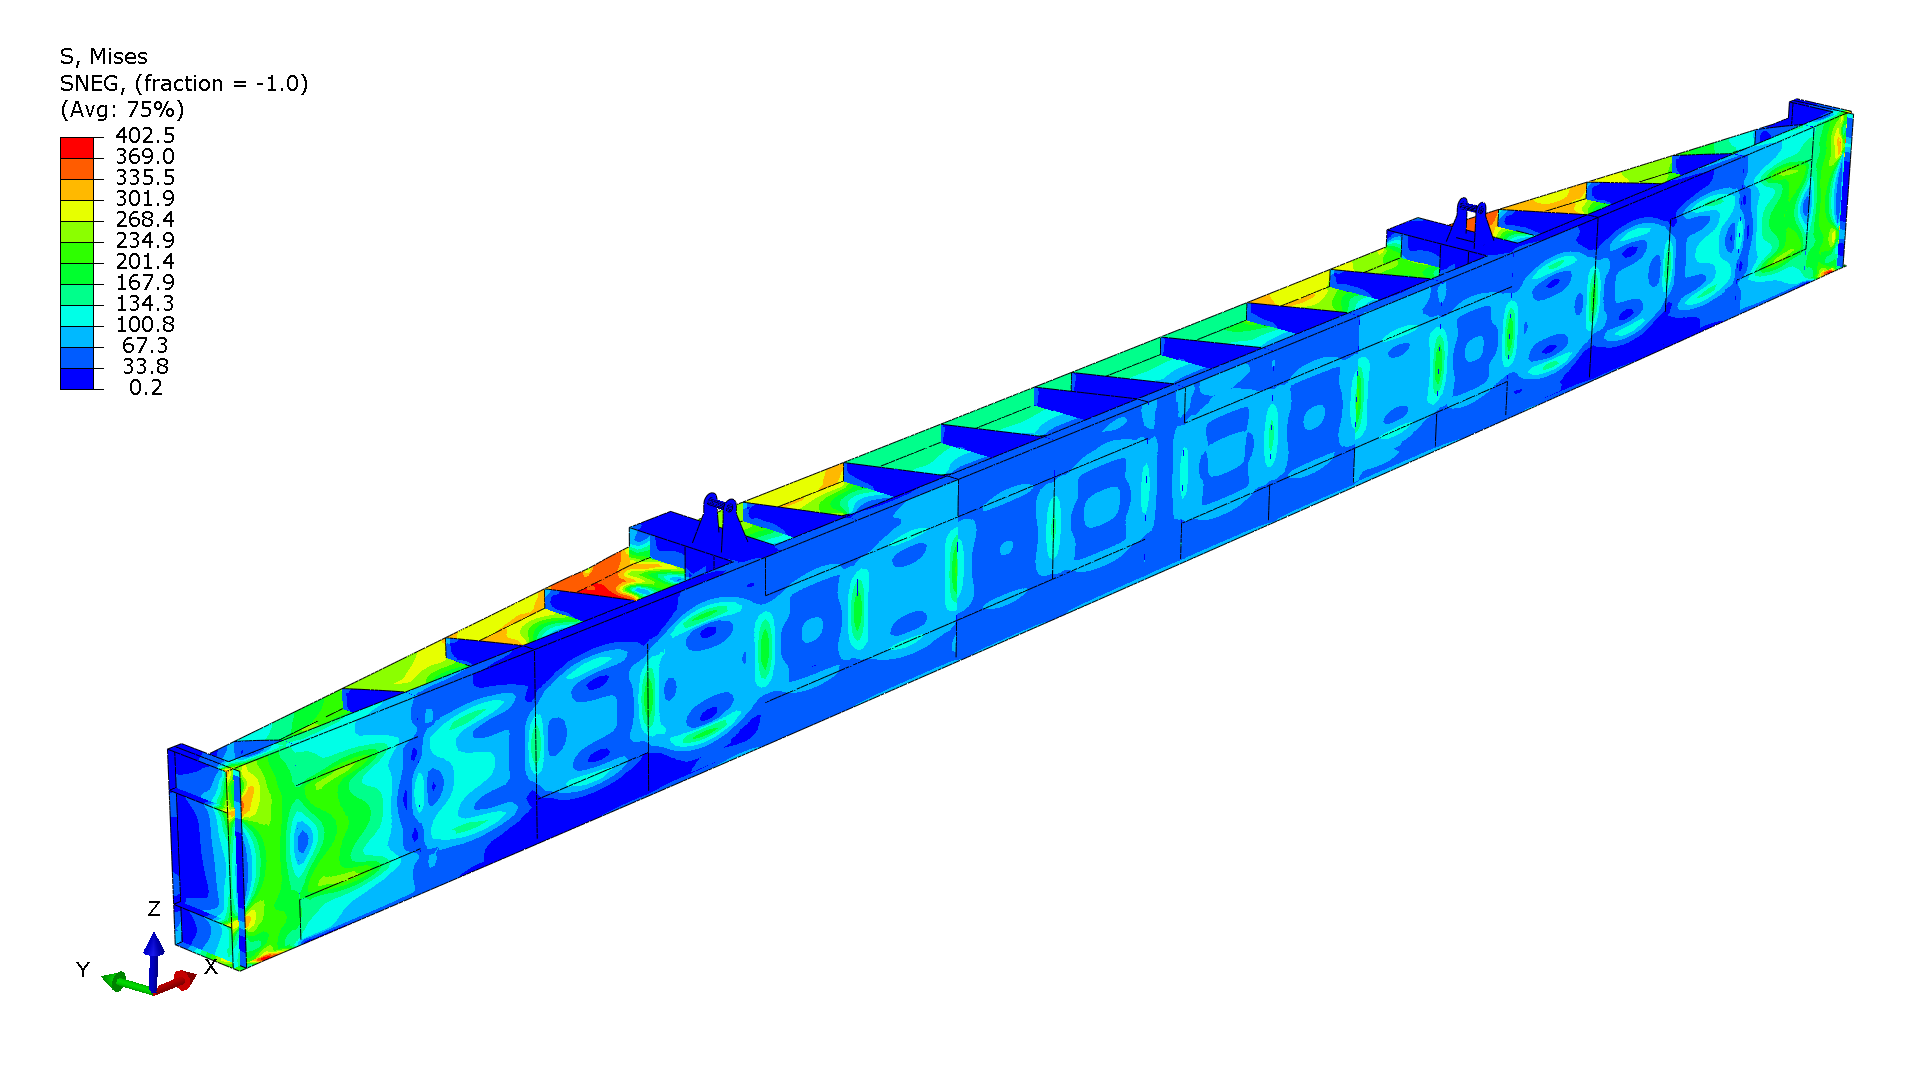 Stress in the stop log at max load capacity
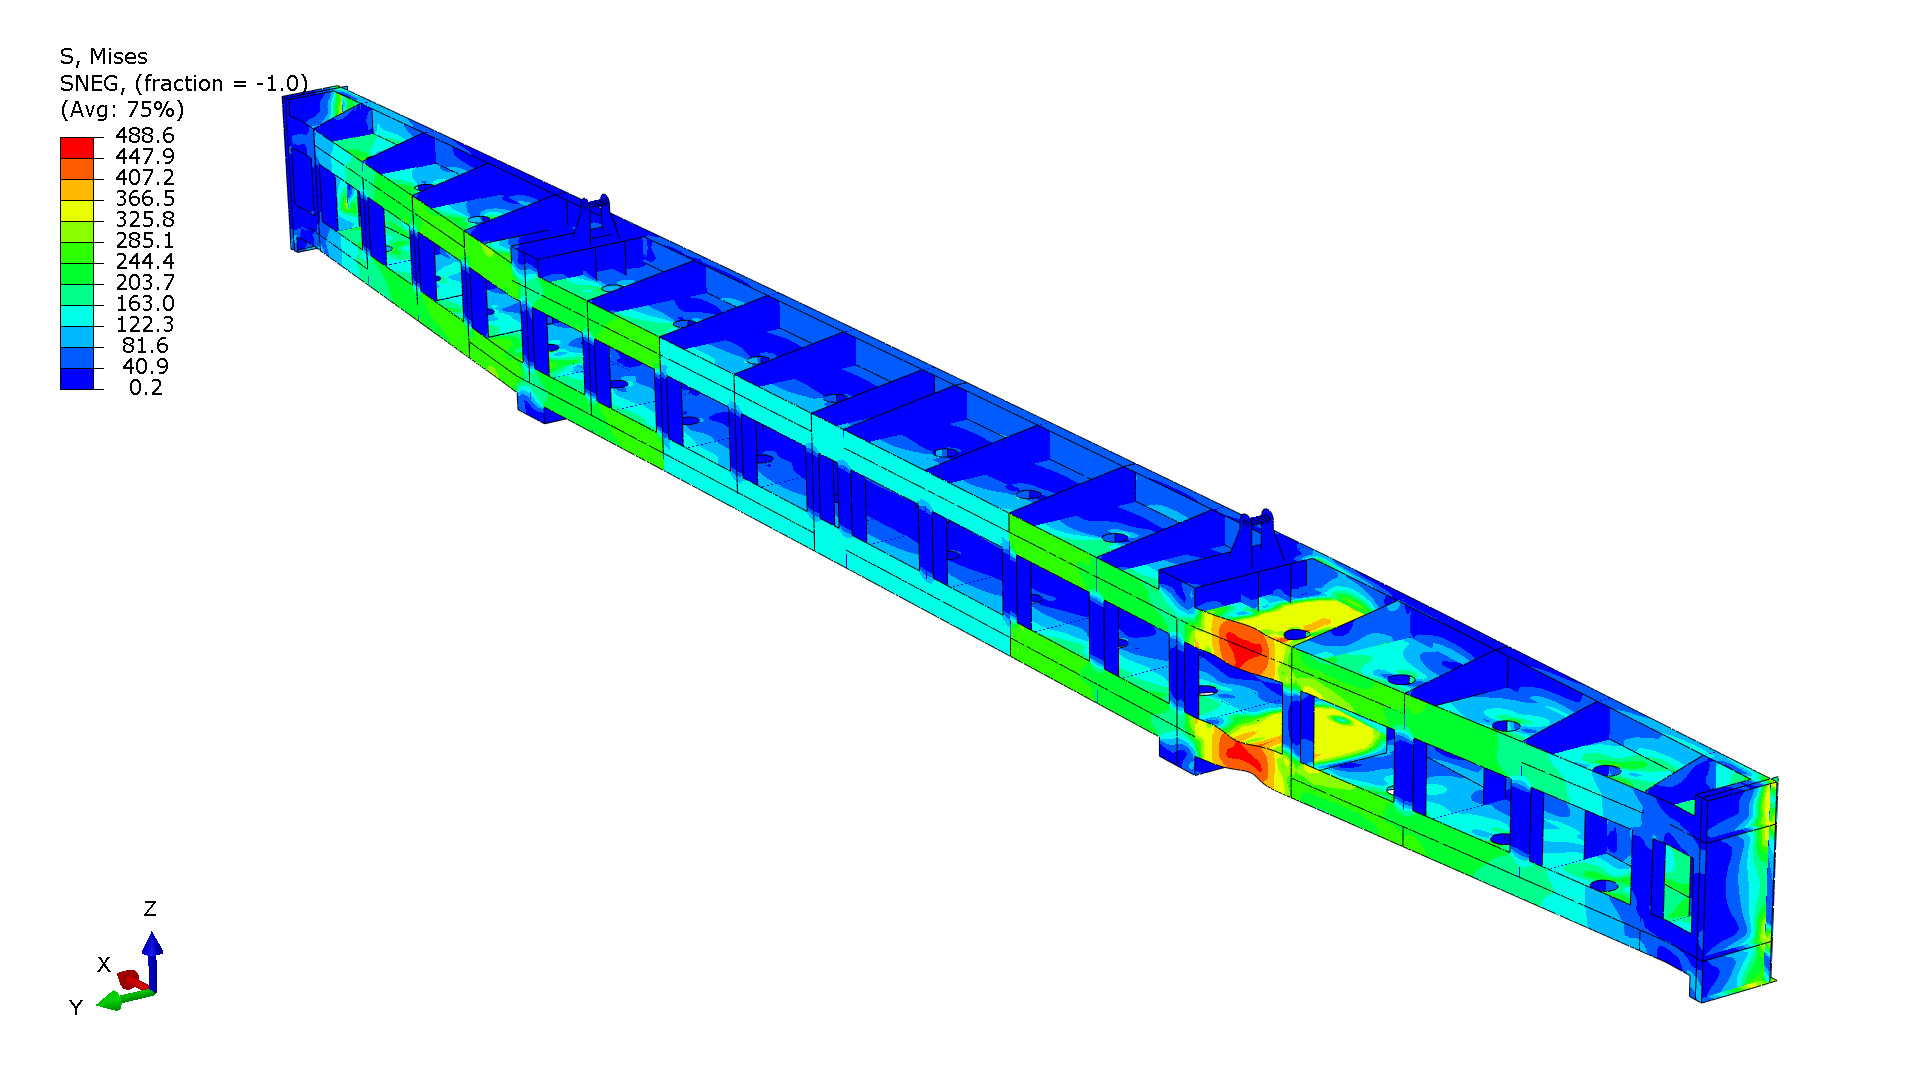
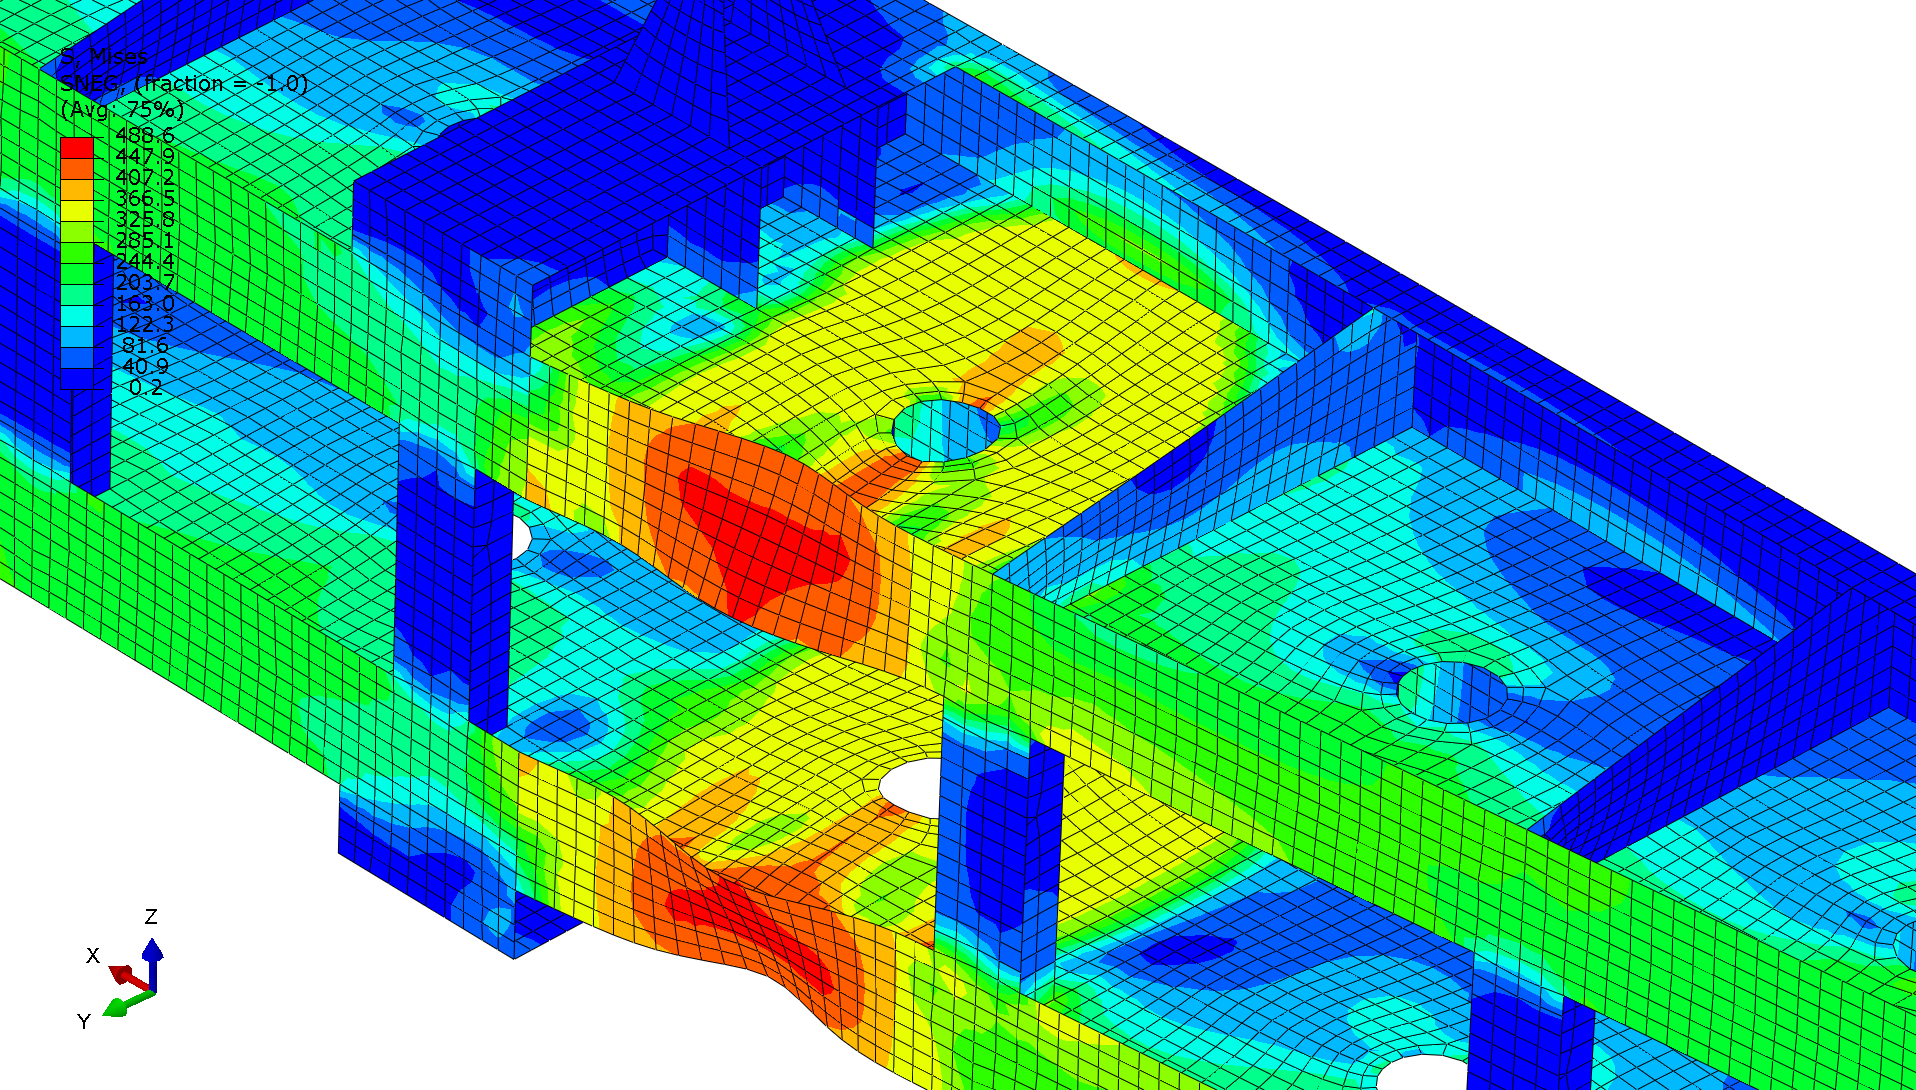 Stress in the stop log at post buckling
 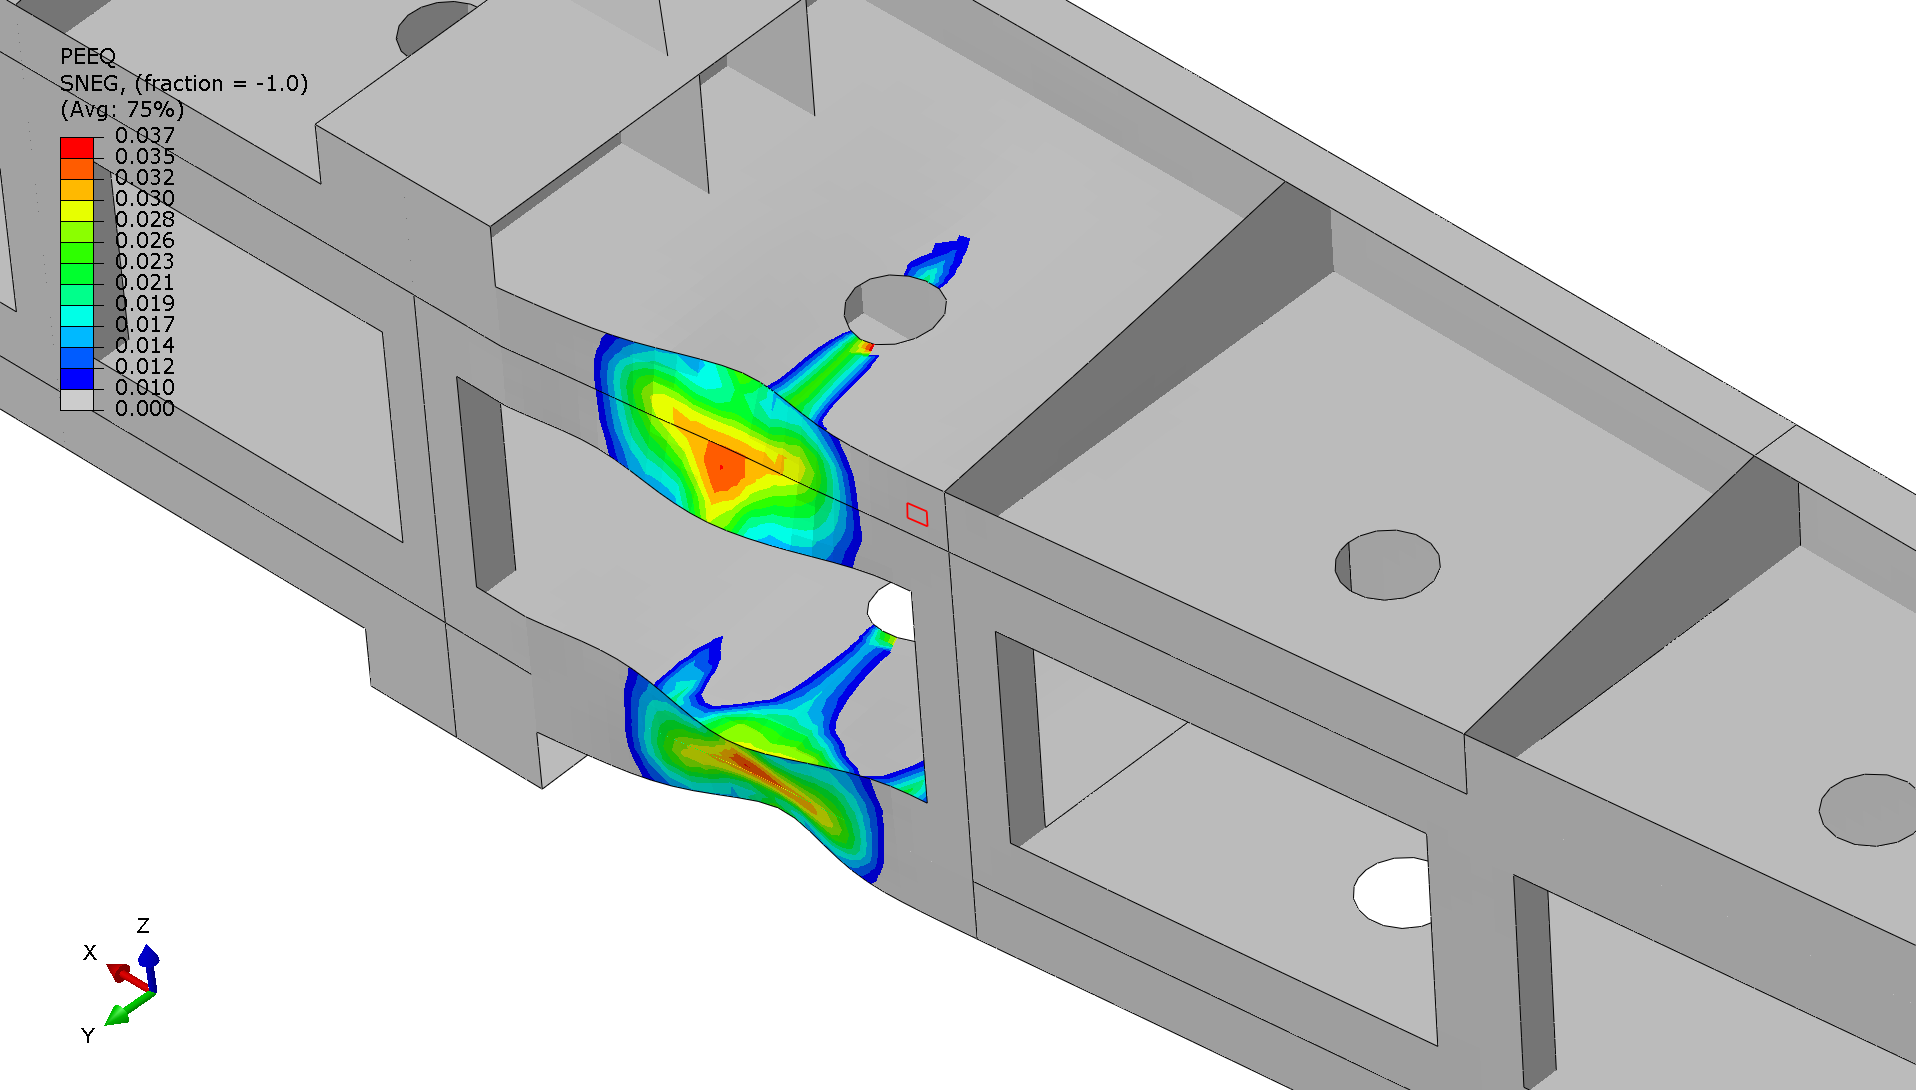 Equivalent plastic strain in the stop log at post buckling
 Looking at the PEEQ image, the failure pattern is straightforward - the structure fails through localized buckling in the compression flanges. The red areas (highest plastic strain at 0.037) show exactly where failure starts: in the horizontal beam flanges and connection regions. Most of the structure stays elastic (gray areas) while these critical spots buckle and deform plastically. The curved, kidney-shaped strain pattern clearly shows the compression flanges buckling out of plane under water pressure. This creates the wave-like deformation visible in the colored contours - classic local buckling behavior.
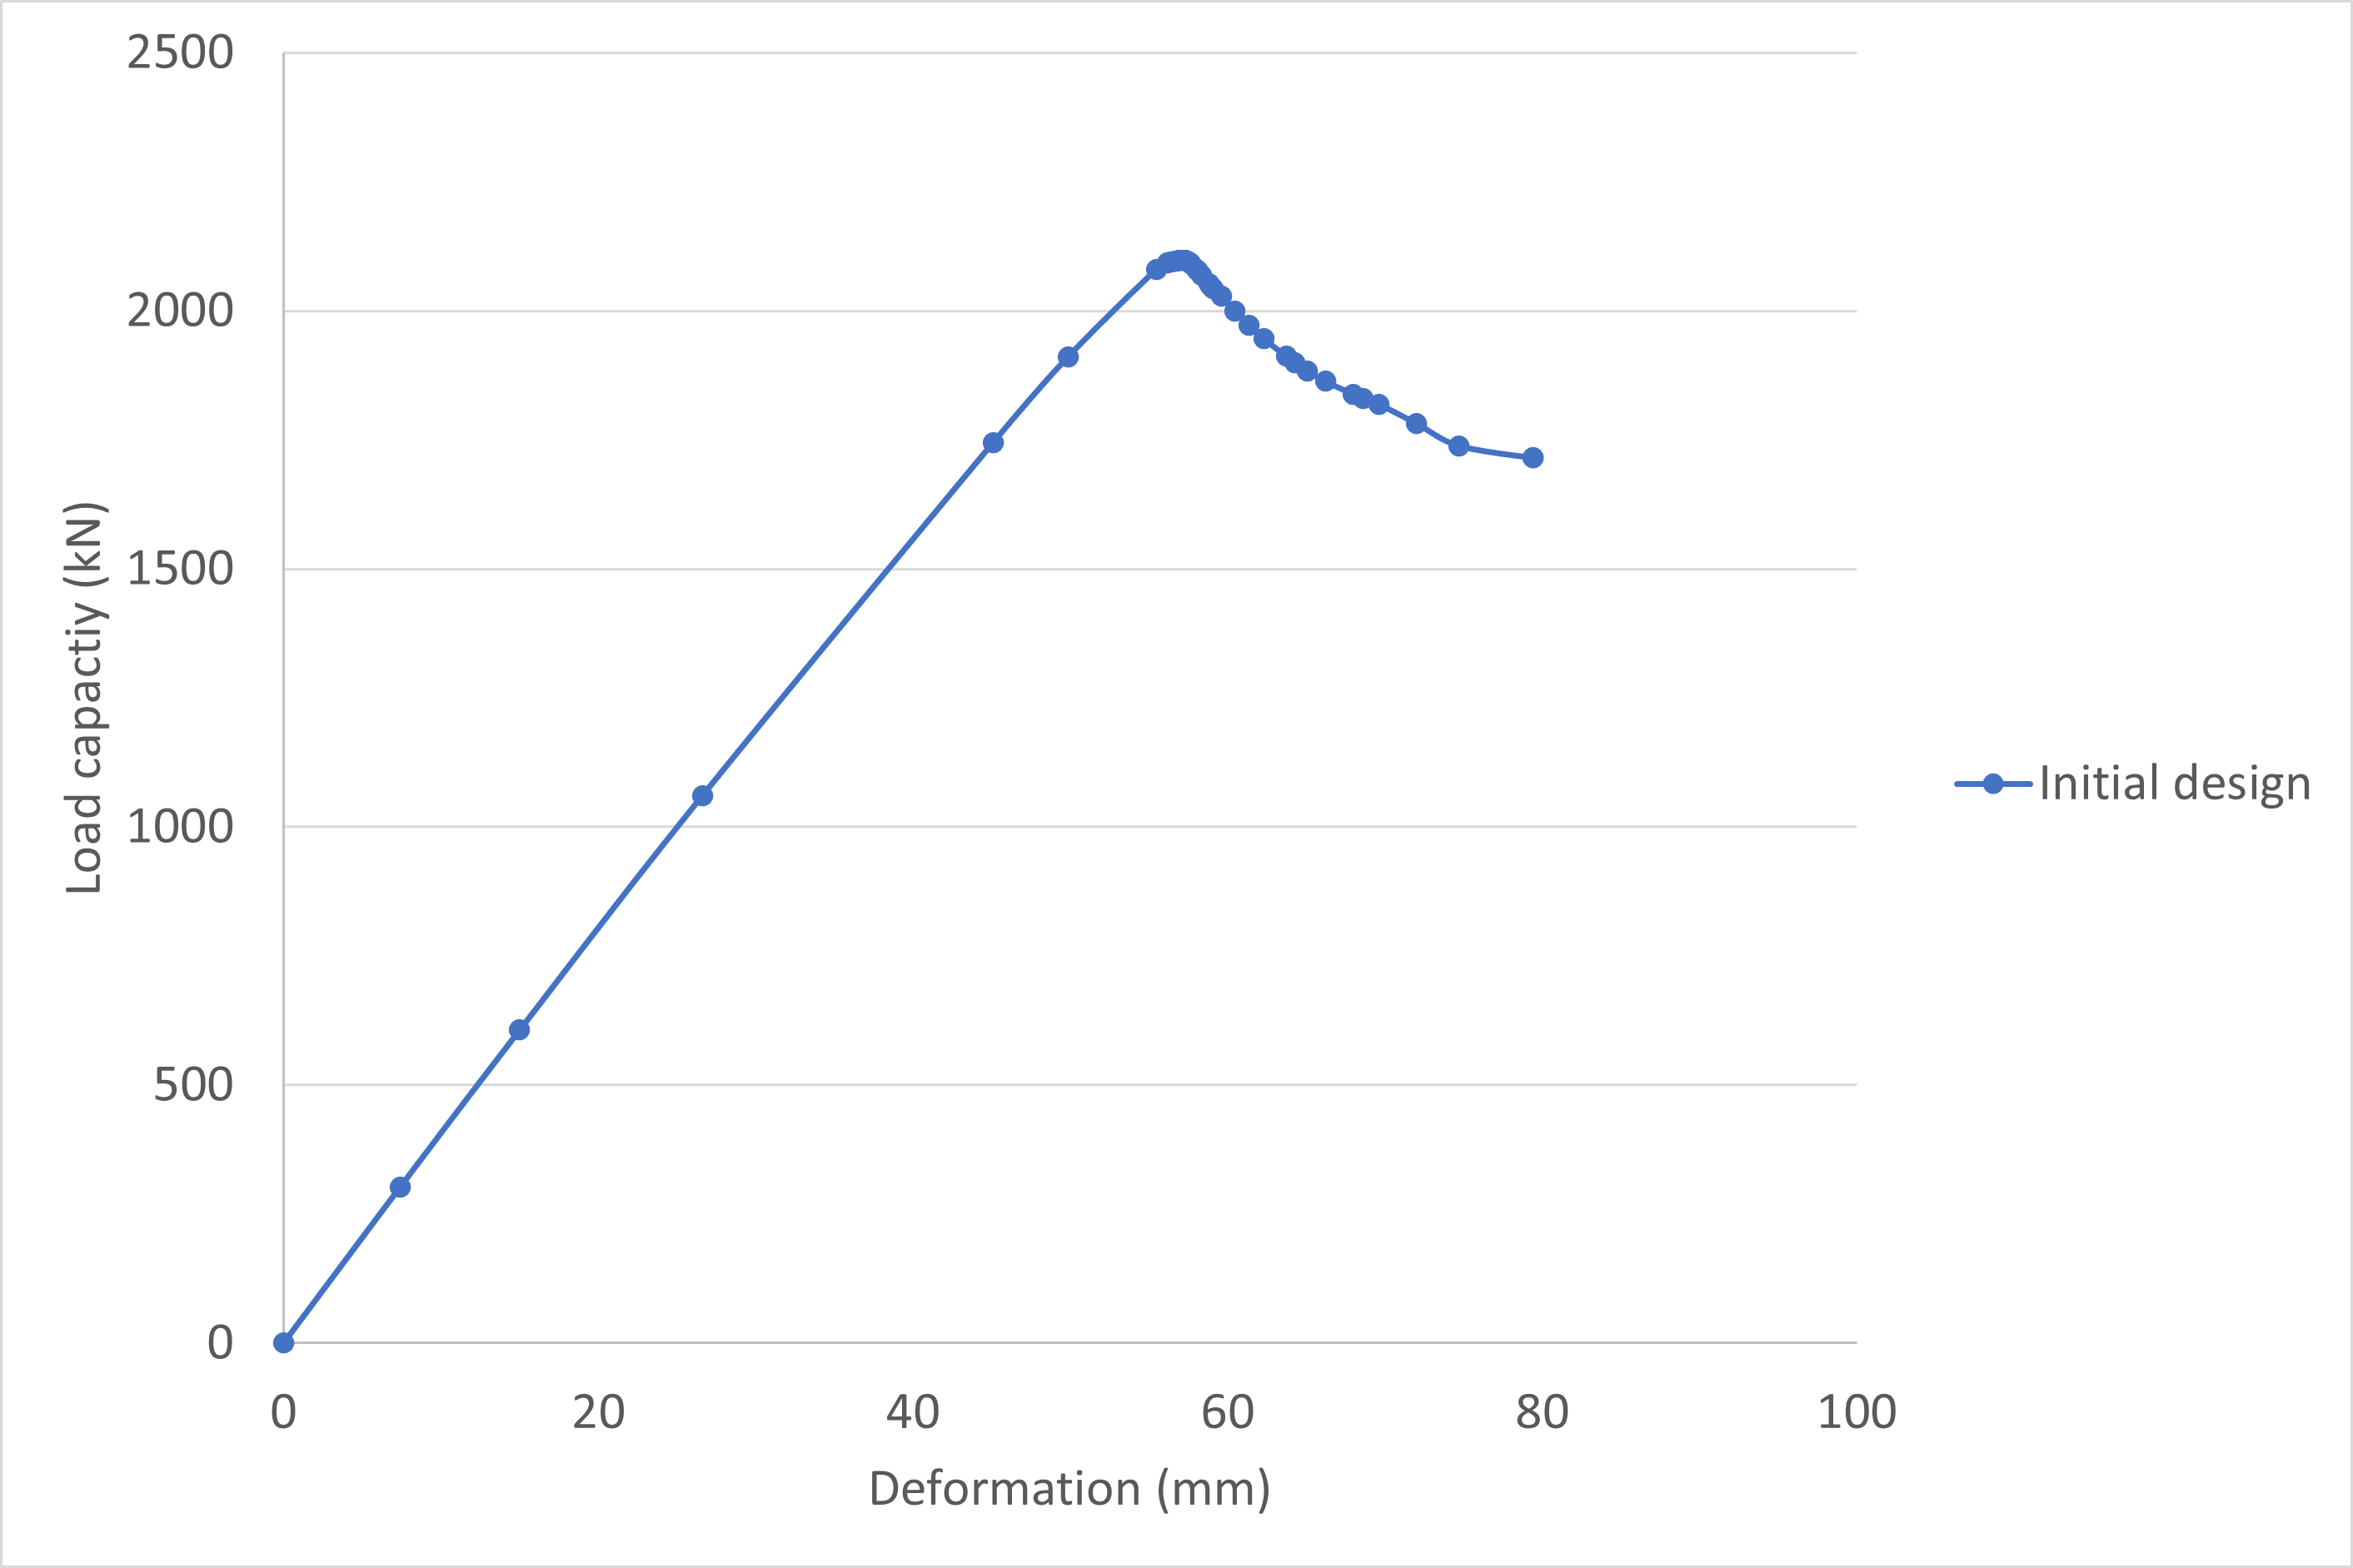 Load capacity graph
 Conclusion
During this initial phase we were able to simulate the failure mode of the stop log and really utilize the nonlinear analysis to see the details of the failure. Knowing where the weak points of the structure are this is a good starting point for the second phase which was increasing the load capacity of the stop log. To be continued...
